Data-center demand does little to explain which states saw the biggest home electricity price increases
The average U.S. residential electricity price rose 19.6% from 2022 to the 12 months ending in July 2026, from 15.04 cents per kilowatt-hour to 17.99 cents, according to the Energy Information Administration. Across the 50 states and Washington, D.C., the amount of electricity data centers use explains almost none of the variation in those increases, with a correlation of 0.06 on a scale where 1 would be a perfect match.
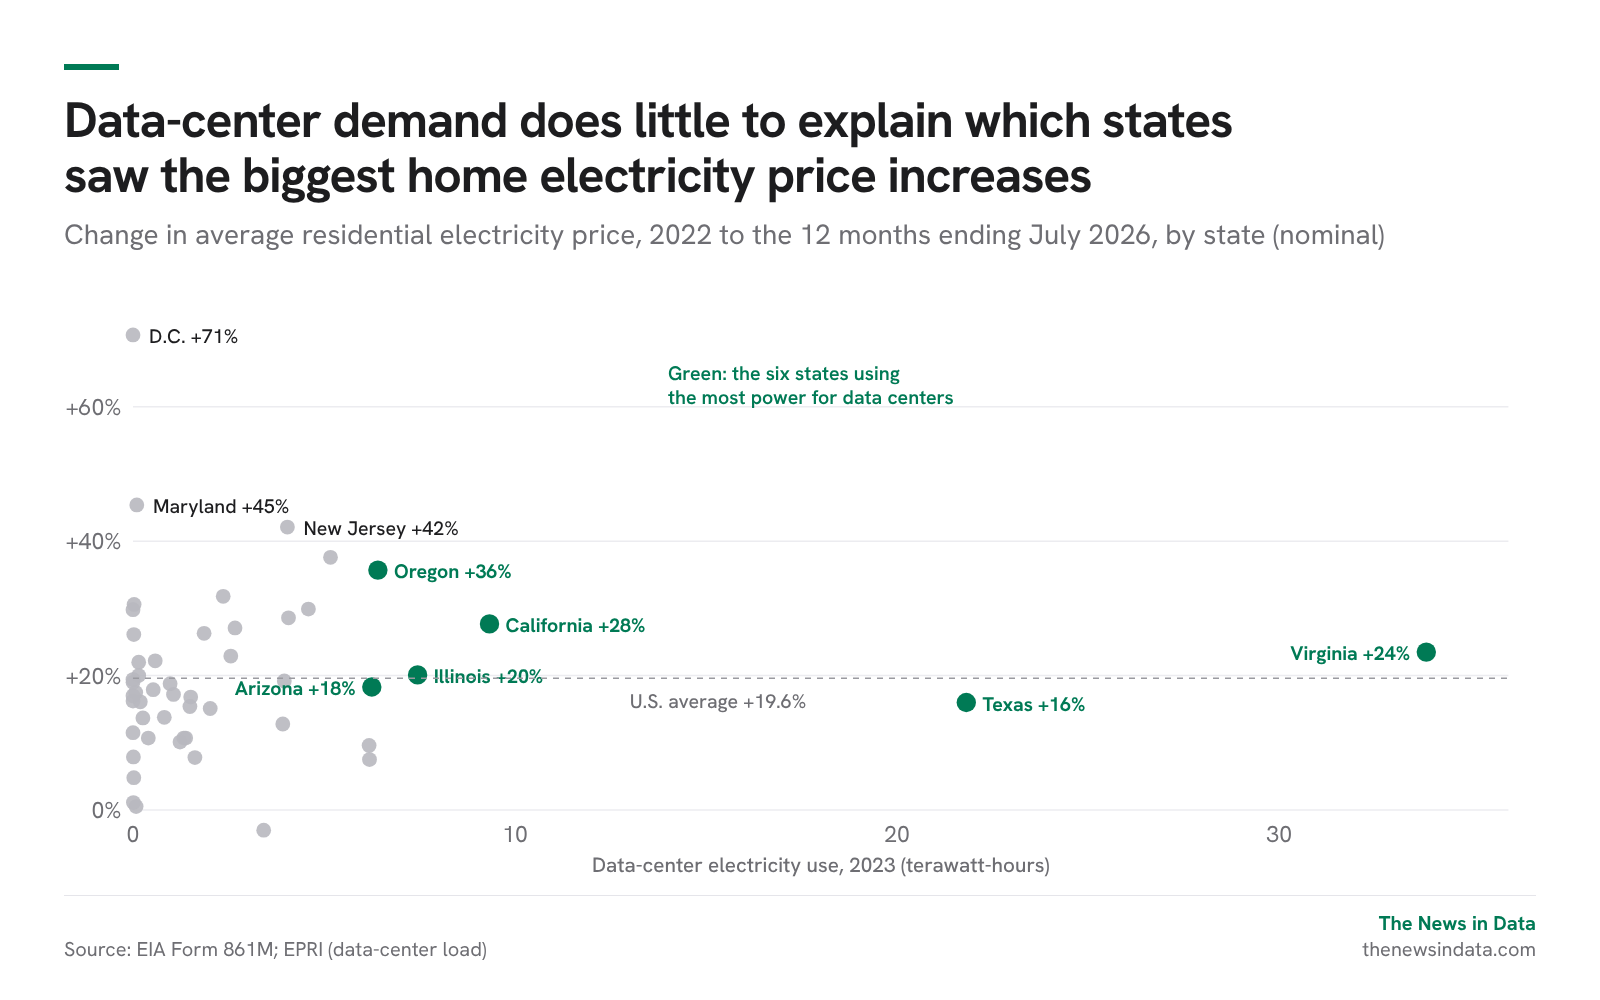
What the chart shows
Virginia, where data centers use about a quarter of all electricity, saw residential prices rise 23.5%. Texas, the second-largest data-center state, rose 16.0%, and Georgia rose 9.6%. The six states with the most data-center load (Virginia, Texas, California, Illinois, Oregon and Arizona) averaged a 23.6% increase against 19.3% for everyone else. That gap disappears with a different list of "top" states, such as the one including Ohio and Georgia in place of California and Oregon (19.9% against 19.8%), so we don't treat it as a pattern.
Where the biggest increases landed
Five of the eight largest increases were in places served by PJM, the grid operator for the Mid-Atlantic and parts of the Midwest: D.C. (70.7%), Maryland (45.4%), New Jersey (42.1%), Ohio (31.8%) and Pennsylvania (29.9%). Washington (37.6%), Oregon (35.7%) and Maine (30.6%) also rose sharply. Business customers show no data-center pattern either, since commercial prices in the six top states rose 12.8% against 13.5% elsewhere, and in Texas they fell 4.8%.
Who pays for new demand
PJM holds an annual auction in which utilities pay power plants to be available in future years, and the cost flows into customers' bills across the whole region. The clearing price rose from $28.92 per megawatt-day for 2024–25 to $269.92 for 2025–26 and $333.44 for 2027–28. PJM's own report attributes much of the higher requirement to forecast load growth "largely due to additional Large Loads," its term for big new users such as data centers. A Maryland household can therefore pay for demand growth in northern Virginia, which a state-by-state chart cannot show.
Our take
The state data argues against a simple story in which data centers raise home bills where they are built. A regional story, in which new demand raises capacity costs shared across a grid, fits the PJM numbers better, though natural gas prices, wildfire costs in the West and transmission spending also move rates, and this analysis doesn't separate them.
What's next
EIA's next monthly electricity data, covering August, is due later this month, and PJM's auction prices for 2026–27 feed into bills from this past June.
How we counted: residential prices are revenue divided by sales from EIA Form 861M, for calendar 2022 and August 2025–July 2026, in nominal cents per kilowatt-hour; 2025–26 data are preliminary. Data-center load is EPRI's 2023 estimate by state (May 2024), which doesn't list seven jurisdictions (counted as zero). Group averages weight each state equally.