42% Of Americans Now Go A Typical Week Without Paying Cash, Up From 24% In 2015
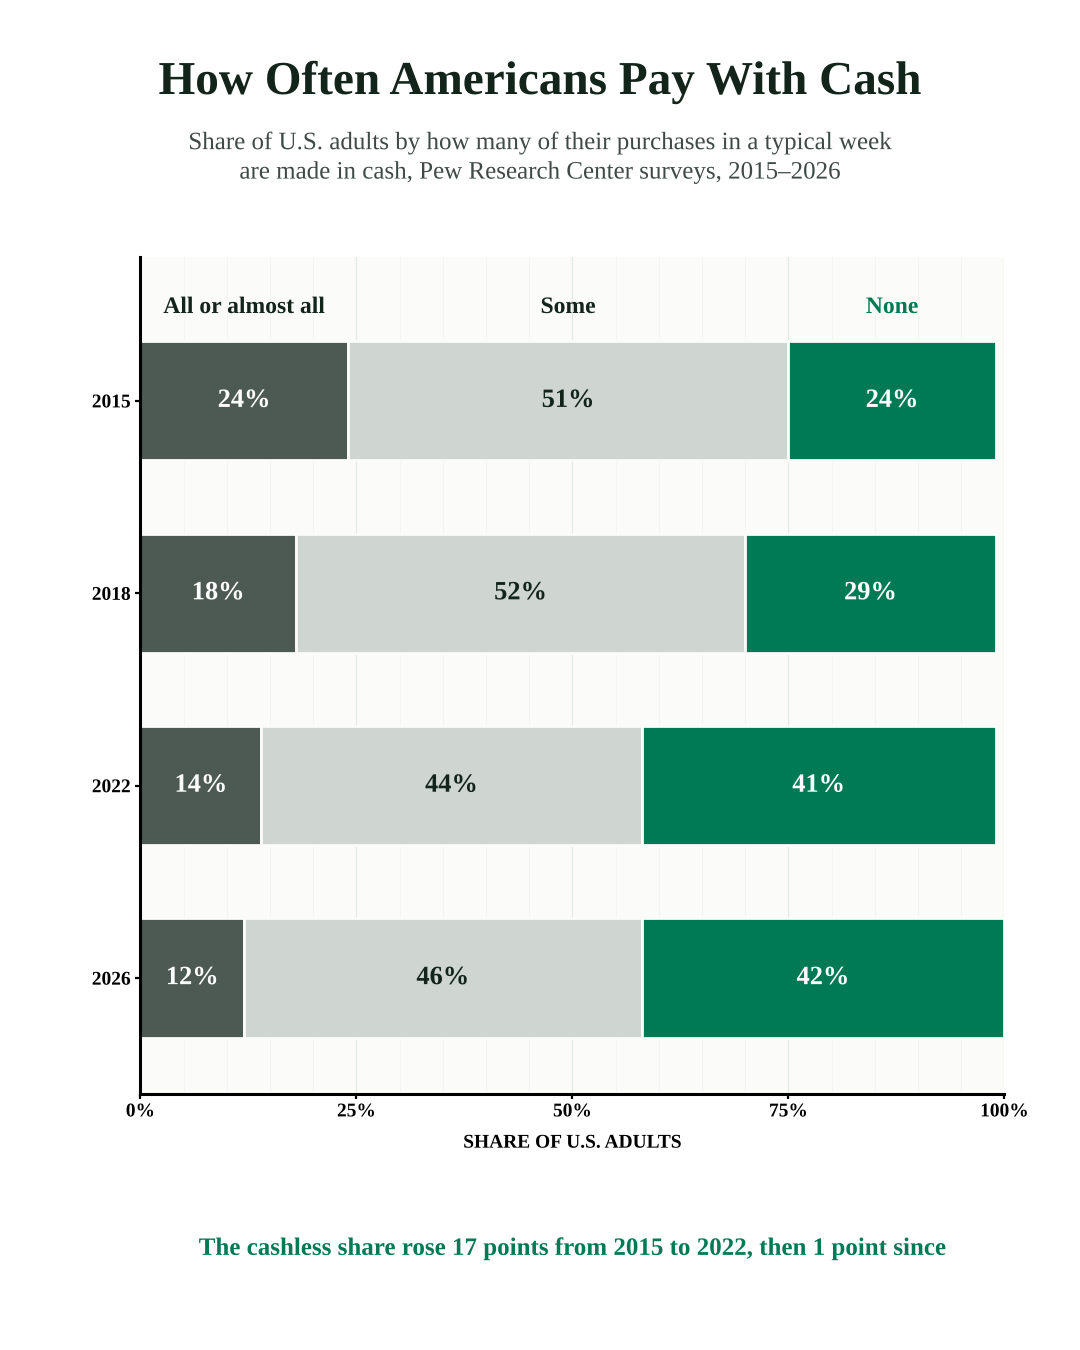
Forty-two percent of U.S. adults say they make none of their purchases in a typical week with cash, according to a Pew Research Center survey of 9,750 adults conducted May 26 to June 1, 2026. In 2015 that share was 24%, and the share who pay cash for all or almost all of their purchases has halved over the same period, from 24% to 12%.
Most of the change came by 2022
The chart shows the cashless share rising from 24% in 2015 to 29% in 2018 and 41% in 2022, a 17-point climb across years that included the pandemic. Since 2022 it has moved only 1 point, to 42%, and the share who use cash for some of their purchases has edged up from 44% to 46%.
Cash is now a small share of payments
The Federal Reserve Bank of Atlanta, which tracks individual payments in its Survey and Diary of Consumer Payment Choice, found that cash made up 14% of payments in 2025, down from 33% in 2015. Credit and charge cards nearly doubled over the same decade, from 18% to 34%, while debit cards held roughly steady at 31%. The typical cash purchase in 2025 was $58, compared with $80 for a credit card purchase.
Income draws the sharpest line
Among adults in households earning $100,000 or more, 58% made no cash purchases in a typical week, more than twice the 24% of those earning under $30,000. The gap runs the other way for heavy cash users, who make up 26% of the lowest-income group and 4% of the highest.
Younger adults have gone furthest
About half of adults 18 to 29 (51%) used no cash in a typical week, compared with 33% of those 65 and older. Older Americans are also far more likely to carry it, as 69% of adults 65 and older carry cash always or most of the time, against 29% of adults under 30. Carrying cash doesn't always mean spending it, though, since 26% of people who usually carry cash say they don't use it for any of their typical purchases.
What's next
A separate Federal Reserve diary study found that consumers made an average of seven cash payments a month in 2024, unchanged since 2020, which fits Pew's finding that the move away from cash has slowed. The Atlanta Fed's next payment survey will show whether cash's 14% share of payments has stopped falling as well.
How we counted: weekly cash use and carrying habits are from Pew Research Center surveys in 2015, 2018, 2022 and 2026; the 2026 survey of 9,750 U.S. adults was conducted May 26–June 1 on Pew's American Trends Panel. Shares may not add to 100% because those who did not answer are not shown. Payment shares by method and average purchase values are from the Federal Reserve Bank of Atlanta's Survey and Diary of Consumer Payment Choice (2015 and 2025), as reported by Pew. Monthly cash payments are from the Federal Reserve's 2025 Diary of Consumer Payment Choice, which covers 2024. Sources: Pew, Aug. 26, 2026; Pew, Sept. 30, 2026; Federal Reserve Financial Services.
You may republish the charts in this story, with credit to The News in Data and a link to this story.