Candy prices are up 49% since 2020, while overall prices rose 29% and wages 28%
The consumer price index for candy and chewing gum rose 48.8% from August 2020 to August 2026, according to the Bureau of Labor Statistics. Over the same period, prices for all goods and services rose 28.9% and average hourly earnings rose 28.0%. After adjusting for overall inflation, candy is 15.5% more expensive than it was in 2020.
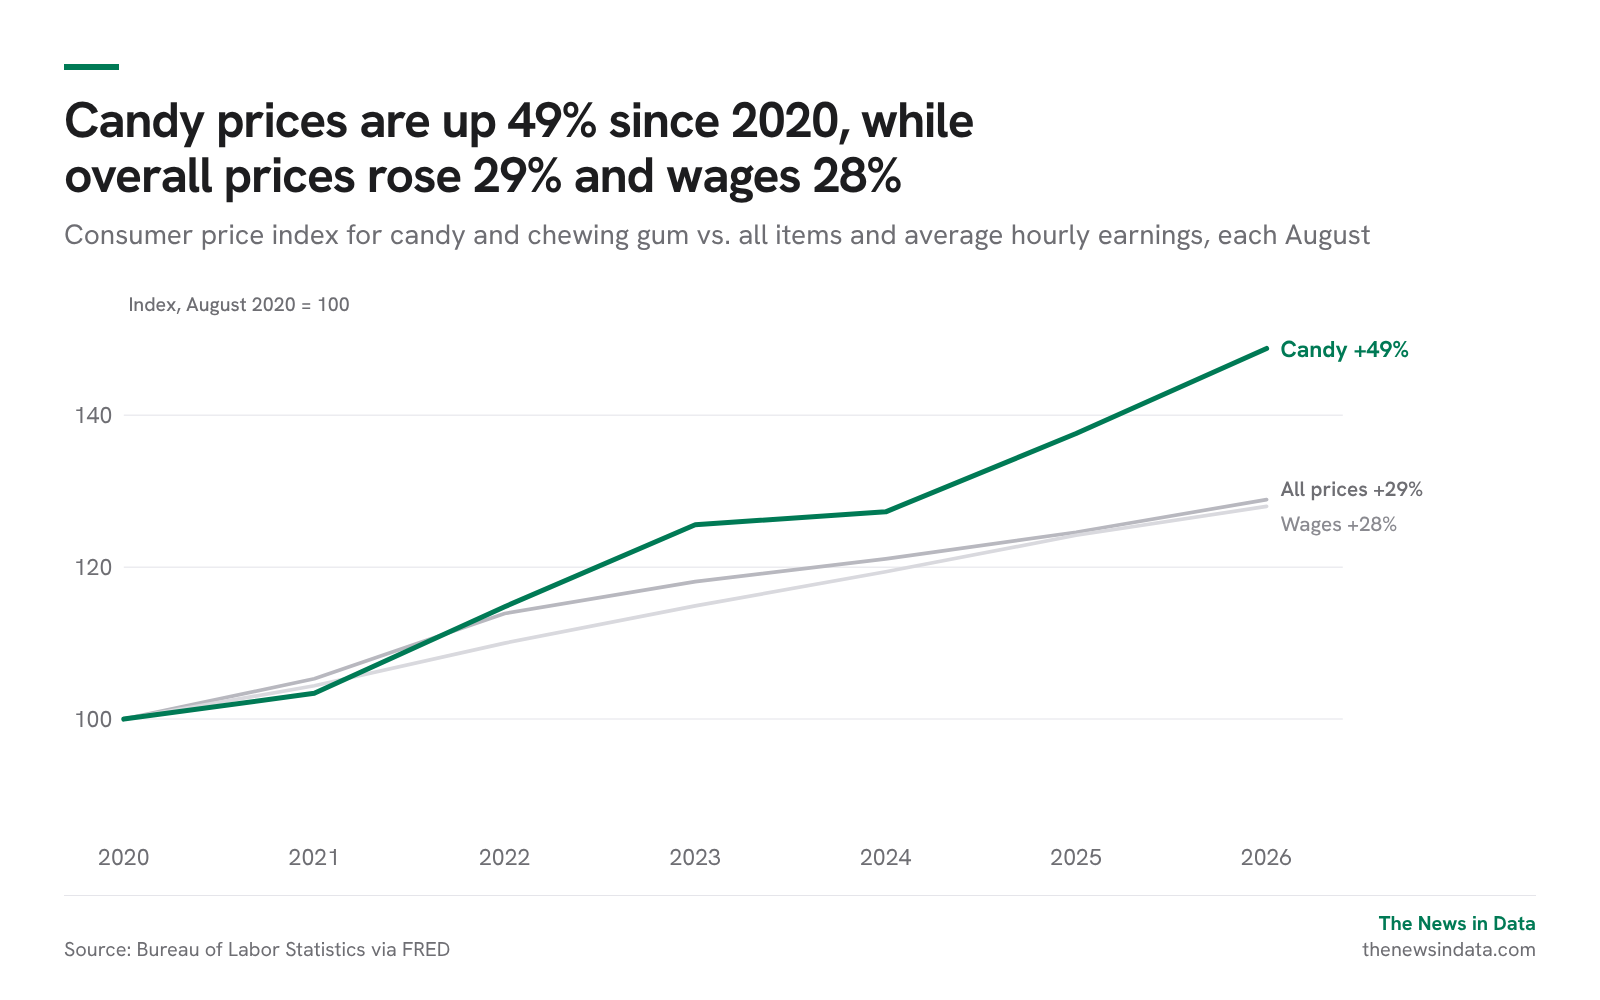
Candy prices rose in two bursts
The first came with the broad inflation of 2021 to 2023, when candy rose 10.9% in the year to August 2022 and 9.4% in the year to August 2023. Prices then rose only 1.4% in the year to August 2024 before climbing 8.1% in each of the next two years, while overall inflation ran at 2.9% and 3.4%.
Cocoa explains part of the second burst
Cocoa futures reached about $12,906 a tonne in December 2024, and they were about $5,670 on Oct. 9, according to Trading Economics. Manufacturers usually buy cocoa months ahead through contracts and hedges, so shelf prices can keep rising after futures fall, which fits the pattern but doesn't prove the cause. We couldn't confirm the cocoa figures with a second source.
Measured in hours of work
At the average private-sector wage, the $50 bag of candy from 2020 took 1.70 hours of work to buy. The same candy now takes 1.97 hours, about 16 minutes more.
People are buying it anyway
The National Retail Federation expects Americans to spend $13.5 billion on Halloween this year, up from $13.1 billion in 2025, including $4.1 billion on candy. In its September survey of 7,889 adults, 96% of consumers said they plan to buy candy.
What's next
September's price data comes out Oct. 14, and the October figures, which cover Halloween itself, follow in November.
How we counted: BLS consumer price indexes for candy and chewing gum and all items (U.S. city average, not seasonally adjusted) and average hourly earnings of all private employees (seasonally adjusted), compared each August via FRED. The candy index covers all candy and gum bought for home use, not only Halloween candy.