Catchers win ball-strike challenges more often than hitters, and success falls late in games as teams spend challenges they would otherwise lose
Catchers won 58.6% of their ball-strike challenges in the first regular season of Major League Baseball's automated ball-strike (ABS) challenge system, compared with 48.8% for batters and 39.6% for pitchers. Across all 10,557 challenges, 5,686 reversed the umpire's call, a rate of about 54%.
Catchers challenged most and won most
Catchers made 5,609 challenges, 53% of the total, and their success rate was about 10 points higher than hitters'. The data can't tell us why, though the usual explanation is that the catcher sees the whole flight of the pitch and catches it near the zone, while the hitter is deciding whether to swing. J.T. Realmuto won 81% of his 86 challenges, the best rate among catchers with at least 75, and Gabriel Moreno, himself a catcher, led batters with 20 or more challenges at 68%. William Contreras made the most challenges of anyone, 185, and won 57% of them.
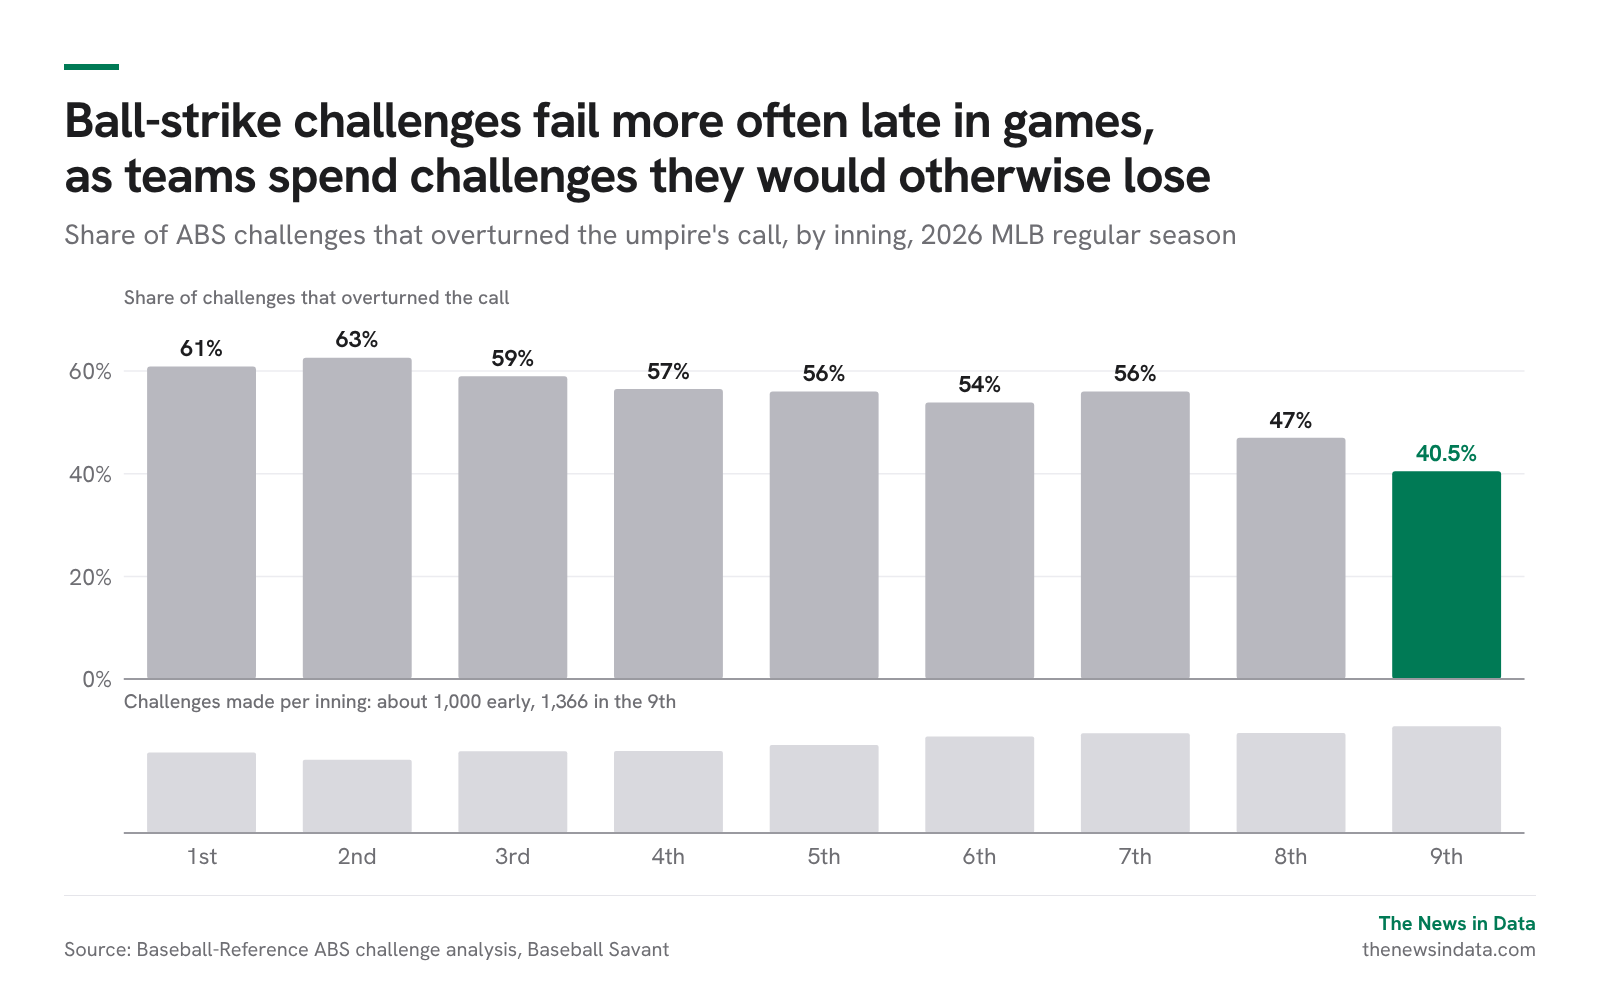
Success falls as the game goes on
Challenges in the first three innings succeeded 60.8% of the time. The rate fell to 55.4% in the fourth through sixth, 51.5% in the seventh and eighth and 40.5% in the ninth, even though the ninth had the most challenges of any inning, 1,366, against about 1,005 per inning early in games.
The decline looks like strategy rather than worse judgment
Unused challenges are worth nothing after the final out, so teams appear to lower their standards late, and Baseball-Reference's breakdown supports that reading. In the ninth inning, teams that still had both challenges won only 36.5% of them, compared with 44.5% for teams down to their last one, and the eighth inning shows the same gap at 44.1% against 50.9%. We couldn't find inning data split by catchers and batters, so we can't say whether both groups decline at the same rate.
Full counts are the hardest call to win
Challenges on 3-2 counts succeeded only 41.0% of the time, compared with 59.8% on the first pitch of an at-bat. Teams also grew more willing to challenge as the season went on, from 3.76 challenges per game in March to 4.61 in September, and most of that increase came from catchers.
What's next
The gap between teams was wide, from Cincinnati's 62% success rate to Pittsburgh's 47%, which suggests some clubs coach the decision better than others. The system is in use throughout this postseason, and we'll update these figures after the World Series to see whether teams choose their spots more carefully when every pitch matters more.
How we counted: 2026 regular-season challenges from Baseball-Reference's ABS challenge analysis (updated Oct. 9) and Baseball Savant, cross-checked against the AP's Oct. 2 season summary. The two sources differ by one overturned challenge. Player and team rates are from the AP.