College Athlete Drug Use By Sport
From the archive: originally published on News, in Data in October 2015. The text and charts appear as they ran then.
College Athletes and Drug Use Rates By Sport
Much research has investigated the relationship between sports participation and drug use. Although the research is somewhat conflicting, the bulk of the studies show a negative relationship between drug use and sports participation. Interestingly, a strong positive relationship between alcohol use and sports participation has been noted in several studies (1,2,3). It was shown, that athletes that participate in technical sports are more likely to use alcohol than similar athletes from endurance or strength based sports. In addition, team-based sports are more likely to see increased alcohol use compared to individual sports, i.e. lacrosse v. golf.
The above figure reports the most recent survey data on substance use in NCAA sports. The values in each box report the overall percentage of use over the previous 12 month period.
As we can see from the above figure, Lacrosse and Hockey players have the highest drug use rates. For example, 95.2 and 98% have used alcohol in the previous 12 months, respectively. Basketball and Track athletes had the lowest rates of drug use.
Which Sport's Athletes Are Most Likely to Use?
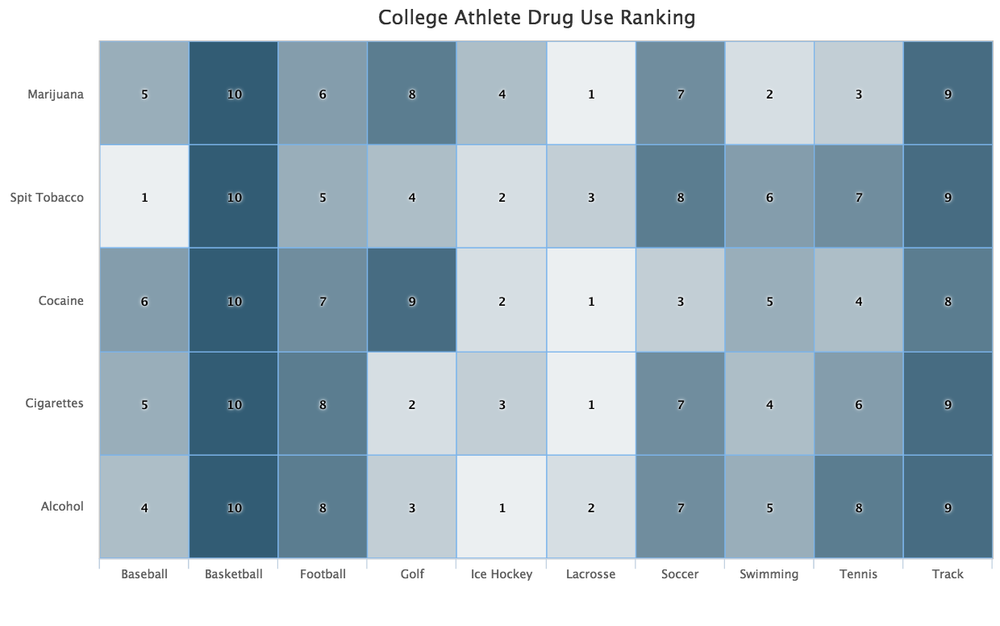
To further investigate the drug use trends and to compare use rates across sports,a ranking system was created. Across each drug type, each sport was ranked in order of prevalence of drug use. The scoring was as follows, a ranking of 1, meant that sport had the highest use rates for that drug category and a score of ten then meant the sport had the lowest use rate. An analysis of the below figure shows that Basketball players had the lowest use rates across the 5 drug types tested. On the other end of the spectrum Lacrosse players were most likely to use drugs. In order of most likely to use to least like to use was as follows:
- Lacrosse
- Ice Hockey
- Baseball
- Swimming
- Golf
- Tennis
- Soccer
- Football
- Track
- Basketball
You may republish the charts in this story, with credit to The News in Data and a link to this story.