For Kameron, Priscilla and Kenna
My wife Kameron, my daughter Priscilla and my son's girlfriend Kenna are all flying this holiday season, and all three are scared to. I wanted to know whether the numbers back them up, so I compared how often people die traveling by car, bus, train and plane in the U.S. Over the 10 years from 2015 through 2024, cars and light trucks killed 50.9 people for every 10 billion passenger-miles traveled, according to the National Safety Council. Scheduled airlines killed 0.04, about 1/1,400th the rate.
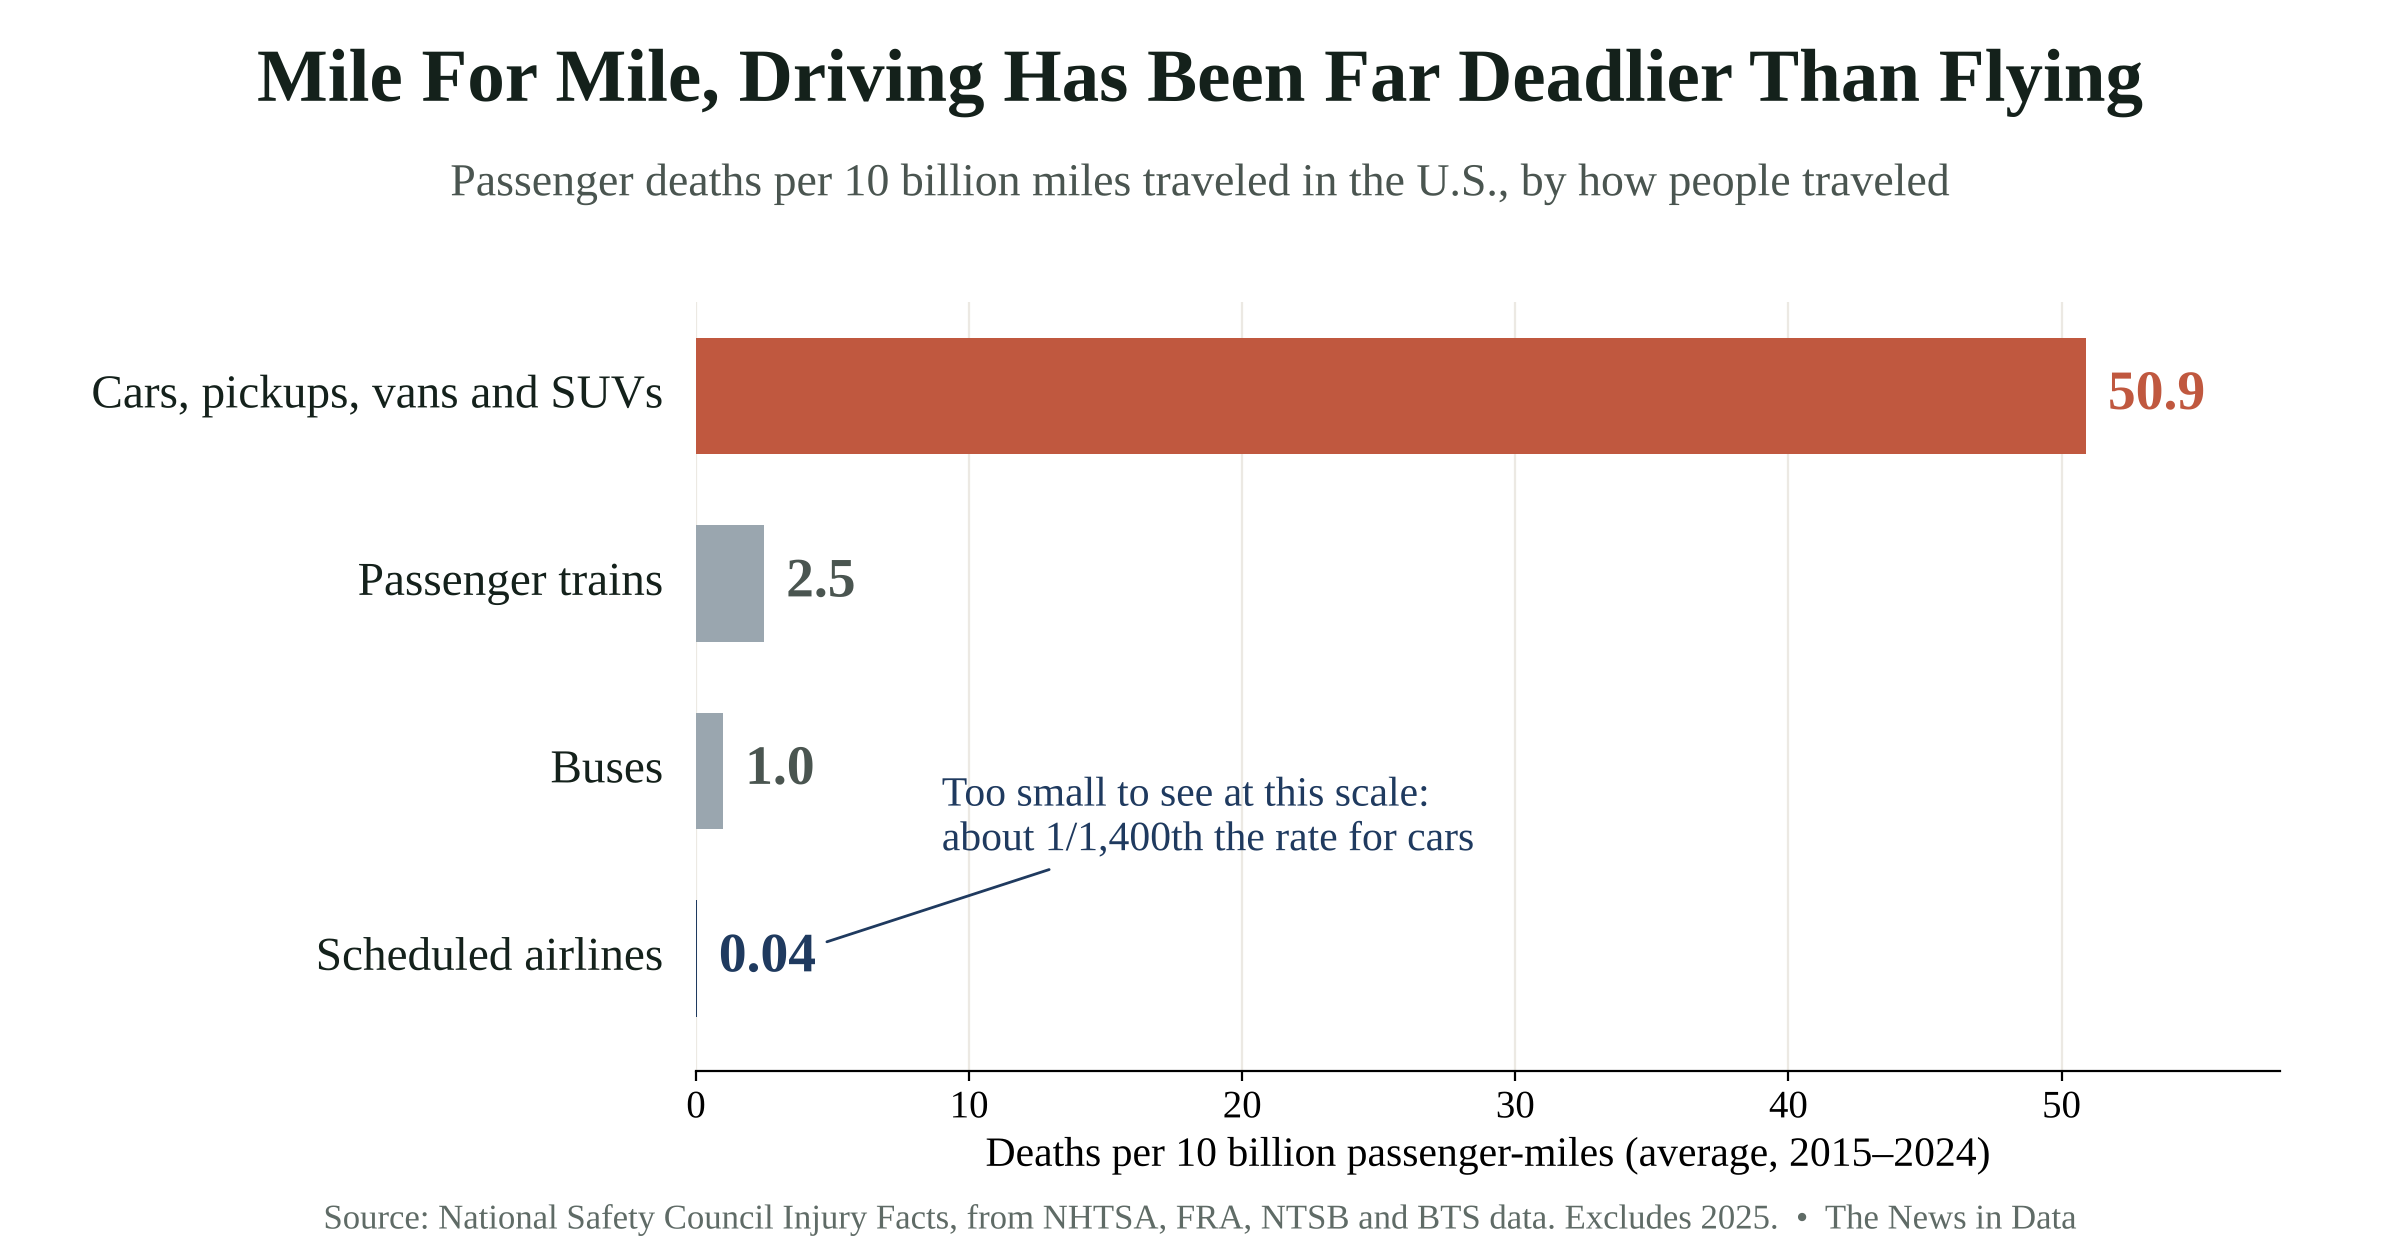
Buses (1.0 deaths per 10 billion miles) and passenger trains (2.5) were also far safer than driving, and the gap with flying is wide enough that you can't see the airline bar on the chart above without zooming in.


How safe is a seat on an airliner?
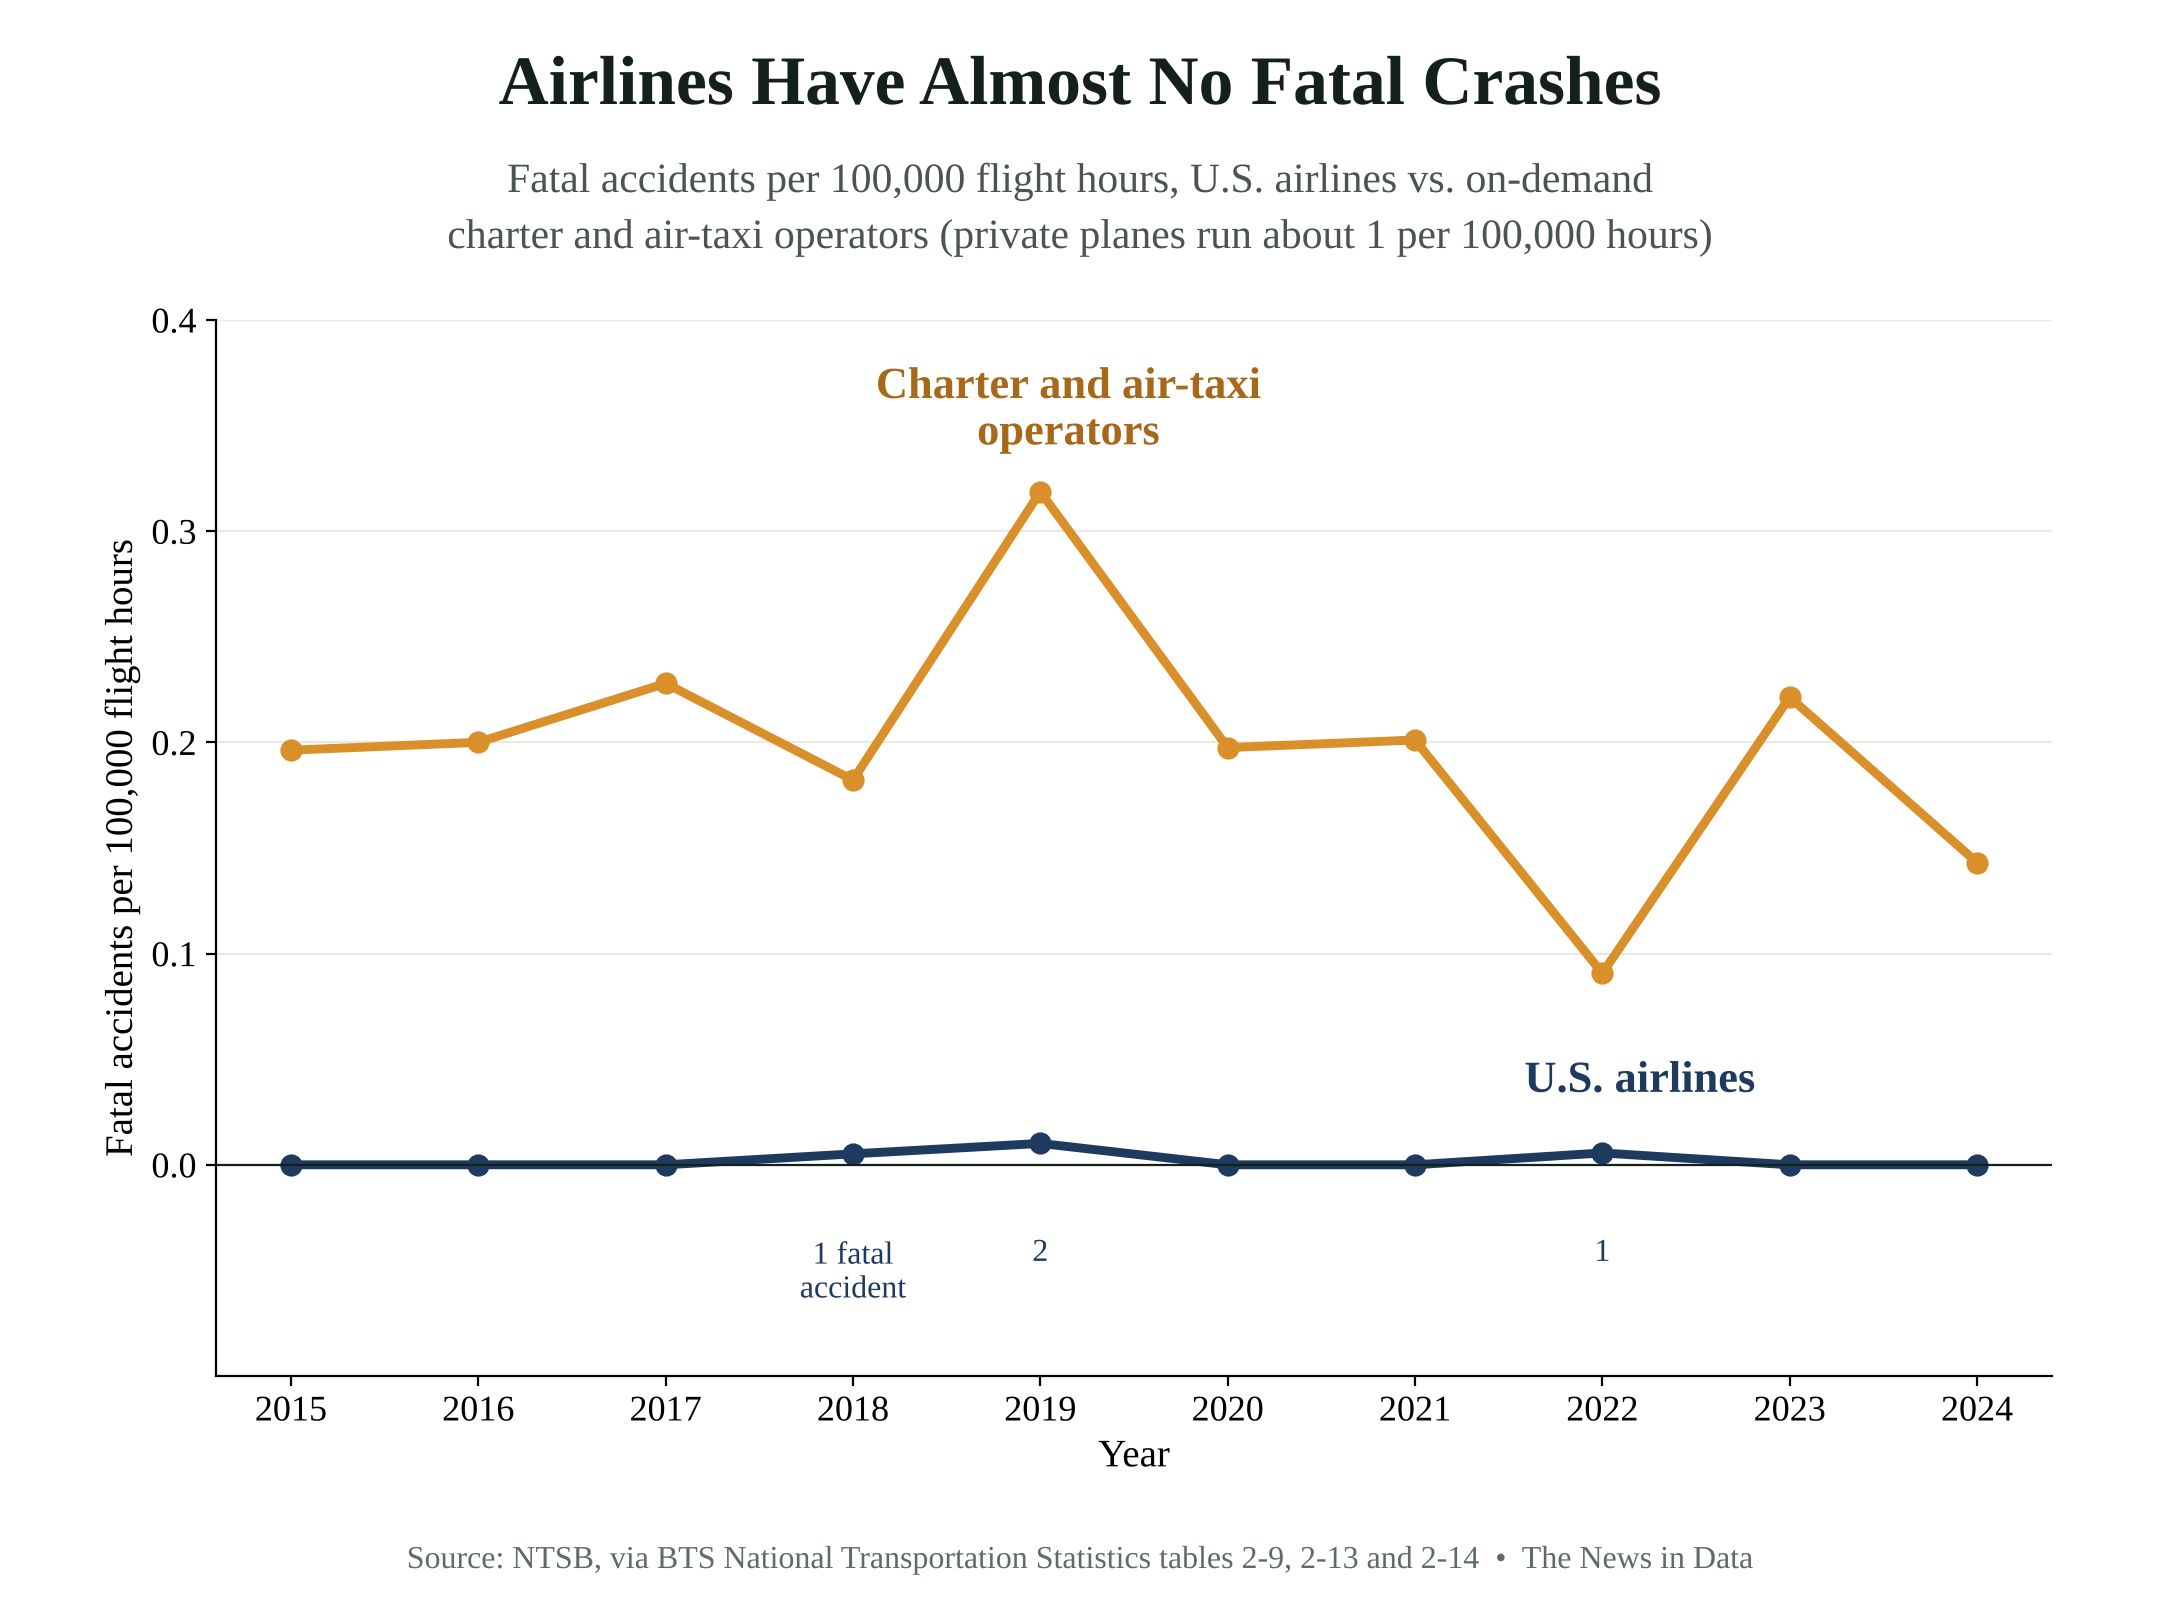
The National Transportation Safety Board counts fatal accidents per 100,000 hours of flying. From 2015 through 2024, U.S. airlines logged about 178 million flight hours and had four fatal accidents, a rate of about 0.002 per 100,000 hours. Only one of those four killed a passenger: a woman on Southwest Airlines Flight 1380 in April 2018, after an engine failed and broke a window.
Smaller operators are a different story. On-demand charter and air-taxi flights, the small planes and private jets people hire, averaged 0.20 fatal accidents per 100,000 hours over the same years, about 95 times the airline rate. Private planes flown by their owners, which the NTSB calls general aviation, averaged 0.95. In 2024, general aviation accidents killed 305 people in the U.S., while U.S. airlines had no fatal accidents.
The crash everyone remembers
On Jan. 29, 2025, American Eagle Flight 5342, operated by PSA Airlines, collided with an Army Black Hawk helicopter on approach to Reagan National Airport near Washington, D.C. All 64 people on the jet and the three soldiers in the helicopter died. It was the first fatal crash of a U.S. passenger airliner since Colgan Air Flight 3407 near Buffalo in 2009, and with the UPS cargo crash in Louisville that November, it made 2025 the deadliest year for U.S. airlines since 2001.
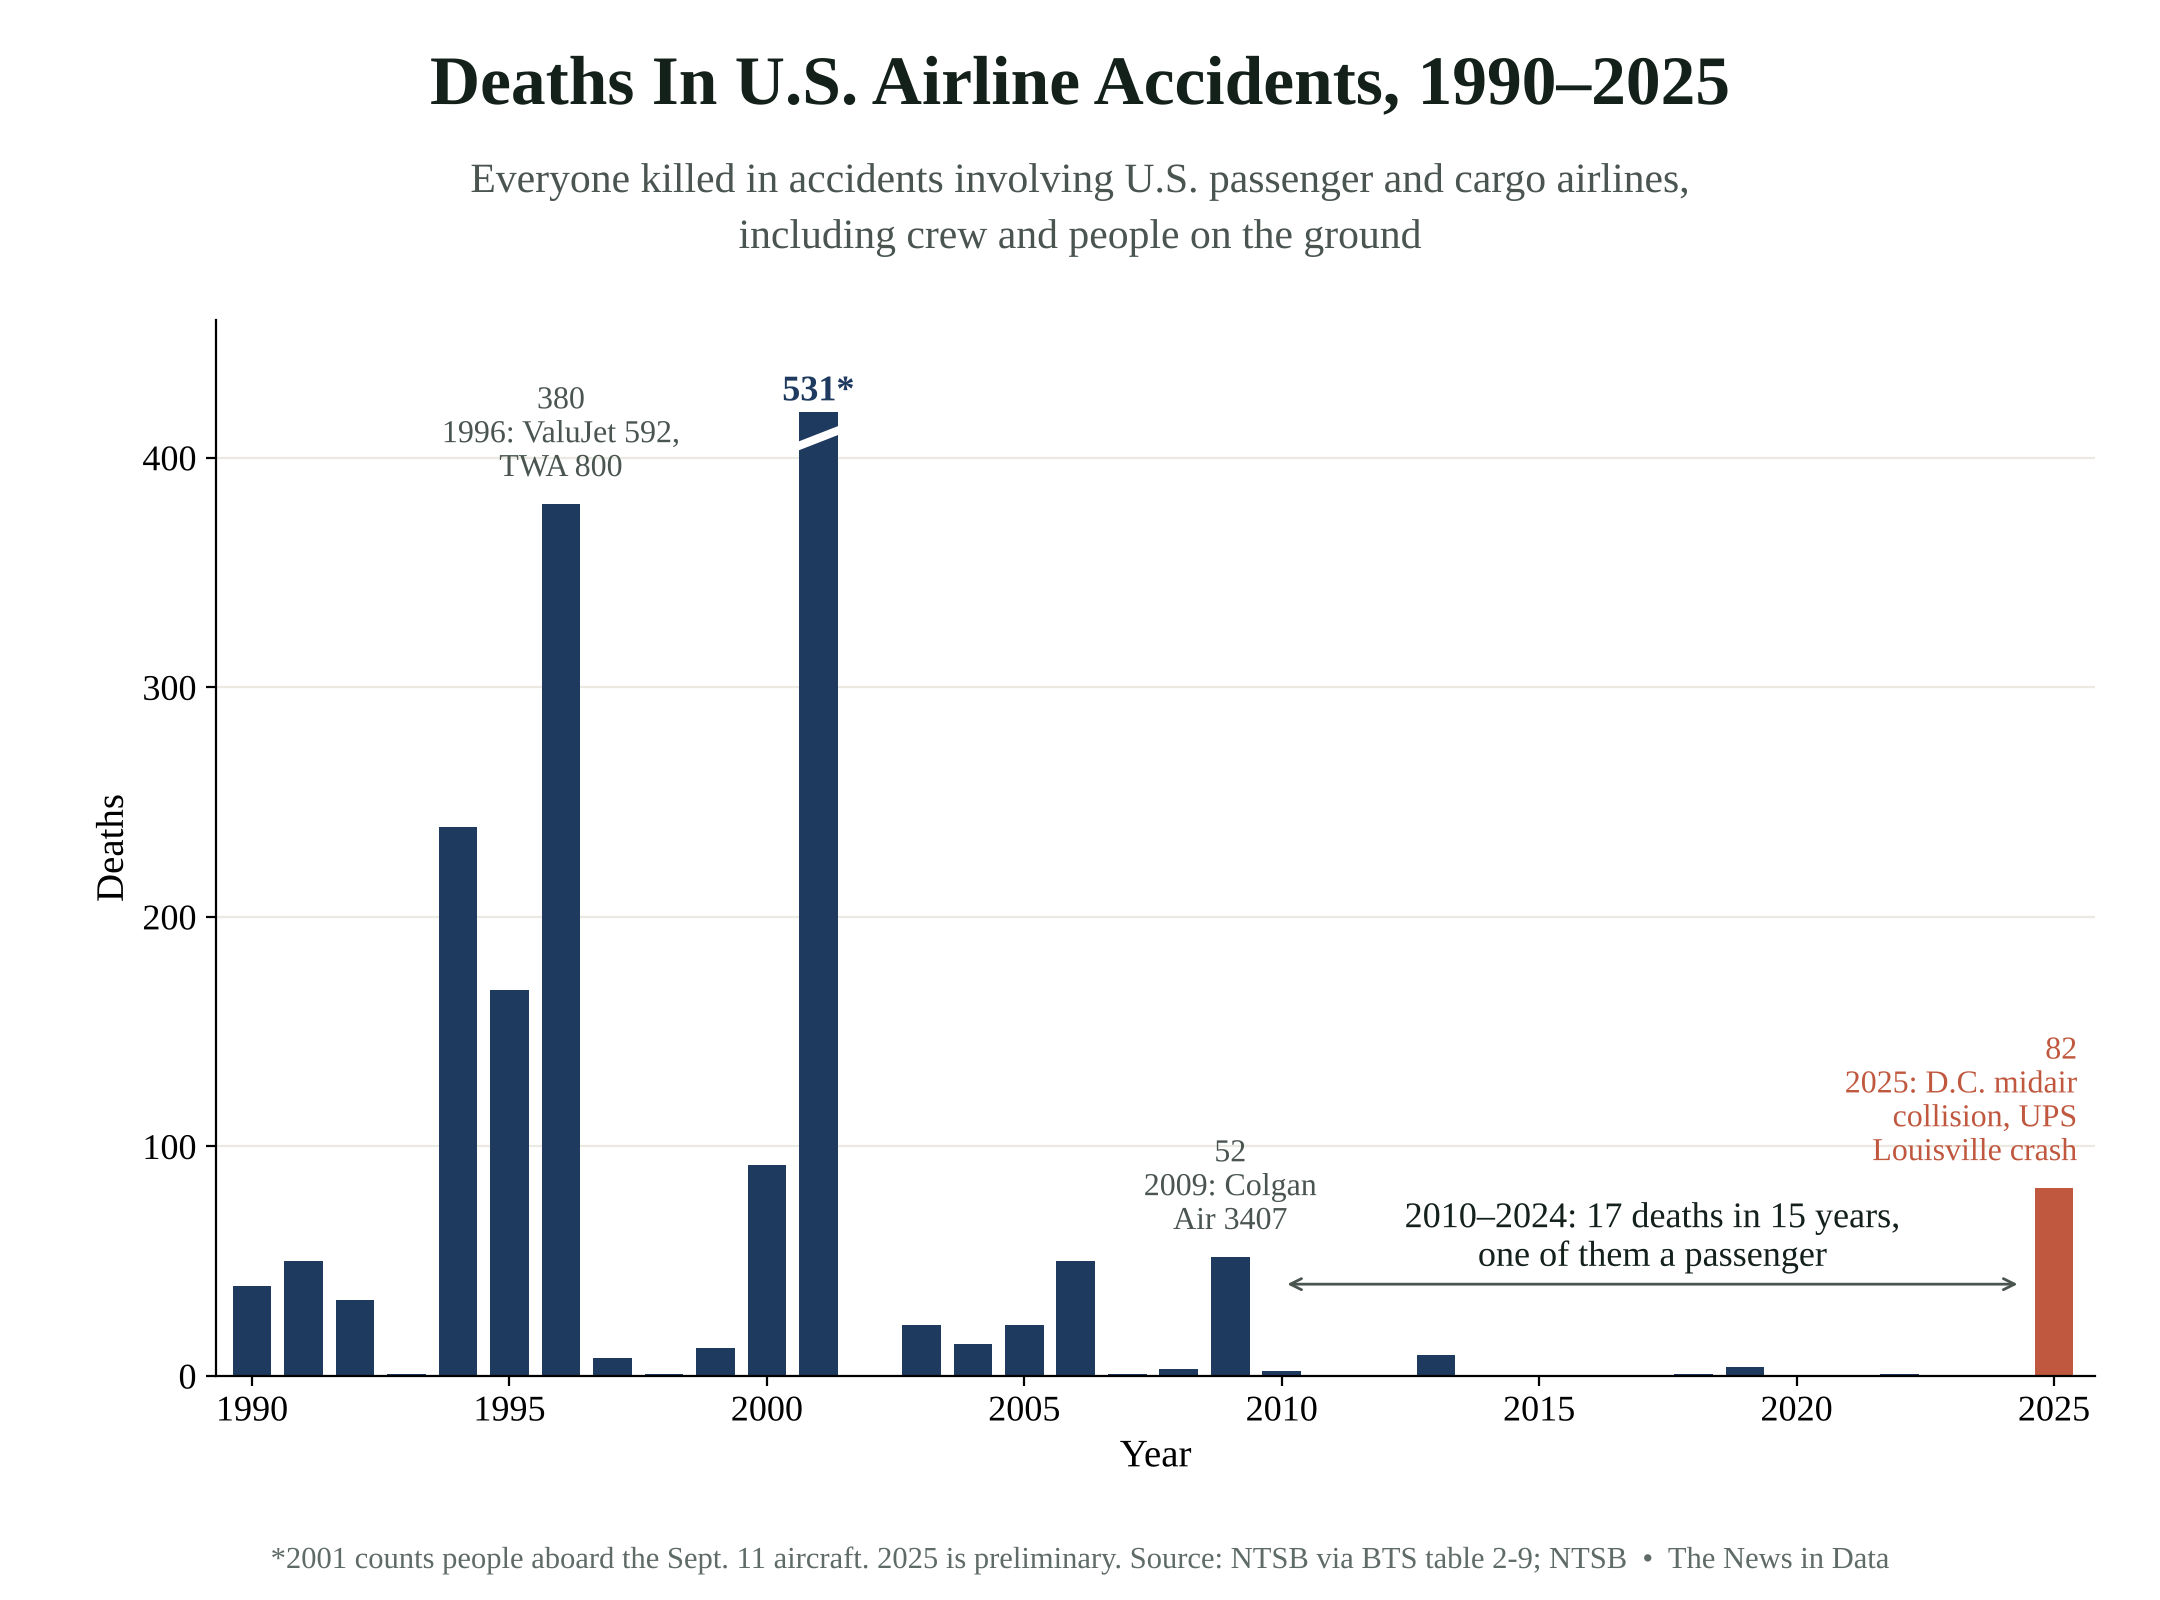
Even counting that crash, flying remained far safer per mile. Adding the 64 deaths on the jet to the airline numbers, against roughly 800 billion domestic passenger-miles in 2025, raises the airline rate for 2016 through 2025 to about 0.12 deaths per 10 billion miles, which is still more than 400 times lower than the rate for cars. The two pilots killed when an Air Canada Express jet hit a fire truck at LaGuardia in March 2026 were on a Canadian carrier and are not in these U.S. airline figures.
Your trip, driving or flying
Per-mile rates can flatter long flights, since most airline accidents happen during takeoff and landing rather than at cruising altitude. A fairer test is the same journey both ways. The calculator below does that, and it counts the drives to and from the airports, because those miles are on the road too.
Take a Dallas-to-Chicago trip, 802 miles by air or about 960 by road. At average death rates, driving it carries about a 1-in-204,000 risk of dying. Flying it, with 40 miles of airport driving, carries about a 1-in-4.7-million risk, and 96% of that comes from the car rides. The flight itself carries about the same risk as driving less than two miles.
The holiday roads are busy. The National Safety Council estimated that 439 people would die in traffic crashes over the five-day Thanksgiving holiday in 2025. No one died on a U.S. airliner during that period.


What the averages leave out
The driving rate is an average across all drivers, so it includes people driving drunk, tired or without a seat belt, and a careful, sober, belted driver faces less risk than the average. Air travel has its own risks the death figures don't show, like serious injuries from turbulence, which mostly happen to people who aren't buckled in. The airline data also covers only U.S. carriers, and the NSC figures stop in 2024, before the D.C. collision, which is why I added it separately.


How we counted: Death rates per passenger-mile by mode are from National Safety Council Injury Facts, which uses NHTSA FARS data for roads, Federal Railroad Administration data for trains, NTSB data for airlines and Bureau of Transportation Statistics passenger-mile estimates; NSC counts drivers as passengers and notes that a 2016 change in passenger-mile sources lowered bus and rail rates. The chart shows 2015–2024 averages; NSC's own summary of the last 10 years puts the car-to-airline ratio at about 1,200 to 1, and the difference comes from rounding in the published airline rates. The 2016–2025 airline estimate adds the 64 deaths aboard American Eagle Flight 5342 to NSC's 2016–2024 rates, using our assumption of about 800 billion U.S. domestic airline passenger-miles in 2025. Fatal accident rates per 100,000 flight hours are NTSB figures published in BTS National Transportation Statistics tables 2-9 (airlines operating under Part 121), 2-13 (on-demand operators under Part 135) and 2-14 (general aviation); 2025 rates are not yet published. Deaths in U.S. airline accidents, 1990–2024, are from table 2-9 and include crew, cargo flights and people on the ground; the 2025 figure of 82 (67 in the D.C. collision and 15 in the UPS crash) is preliminary. The calculator assumes road distance is 1.2 times flight distance. NSC Injury Facts. BTS table 2-9. NSC Thanksgiving estimate. Download our data (CSV).