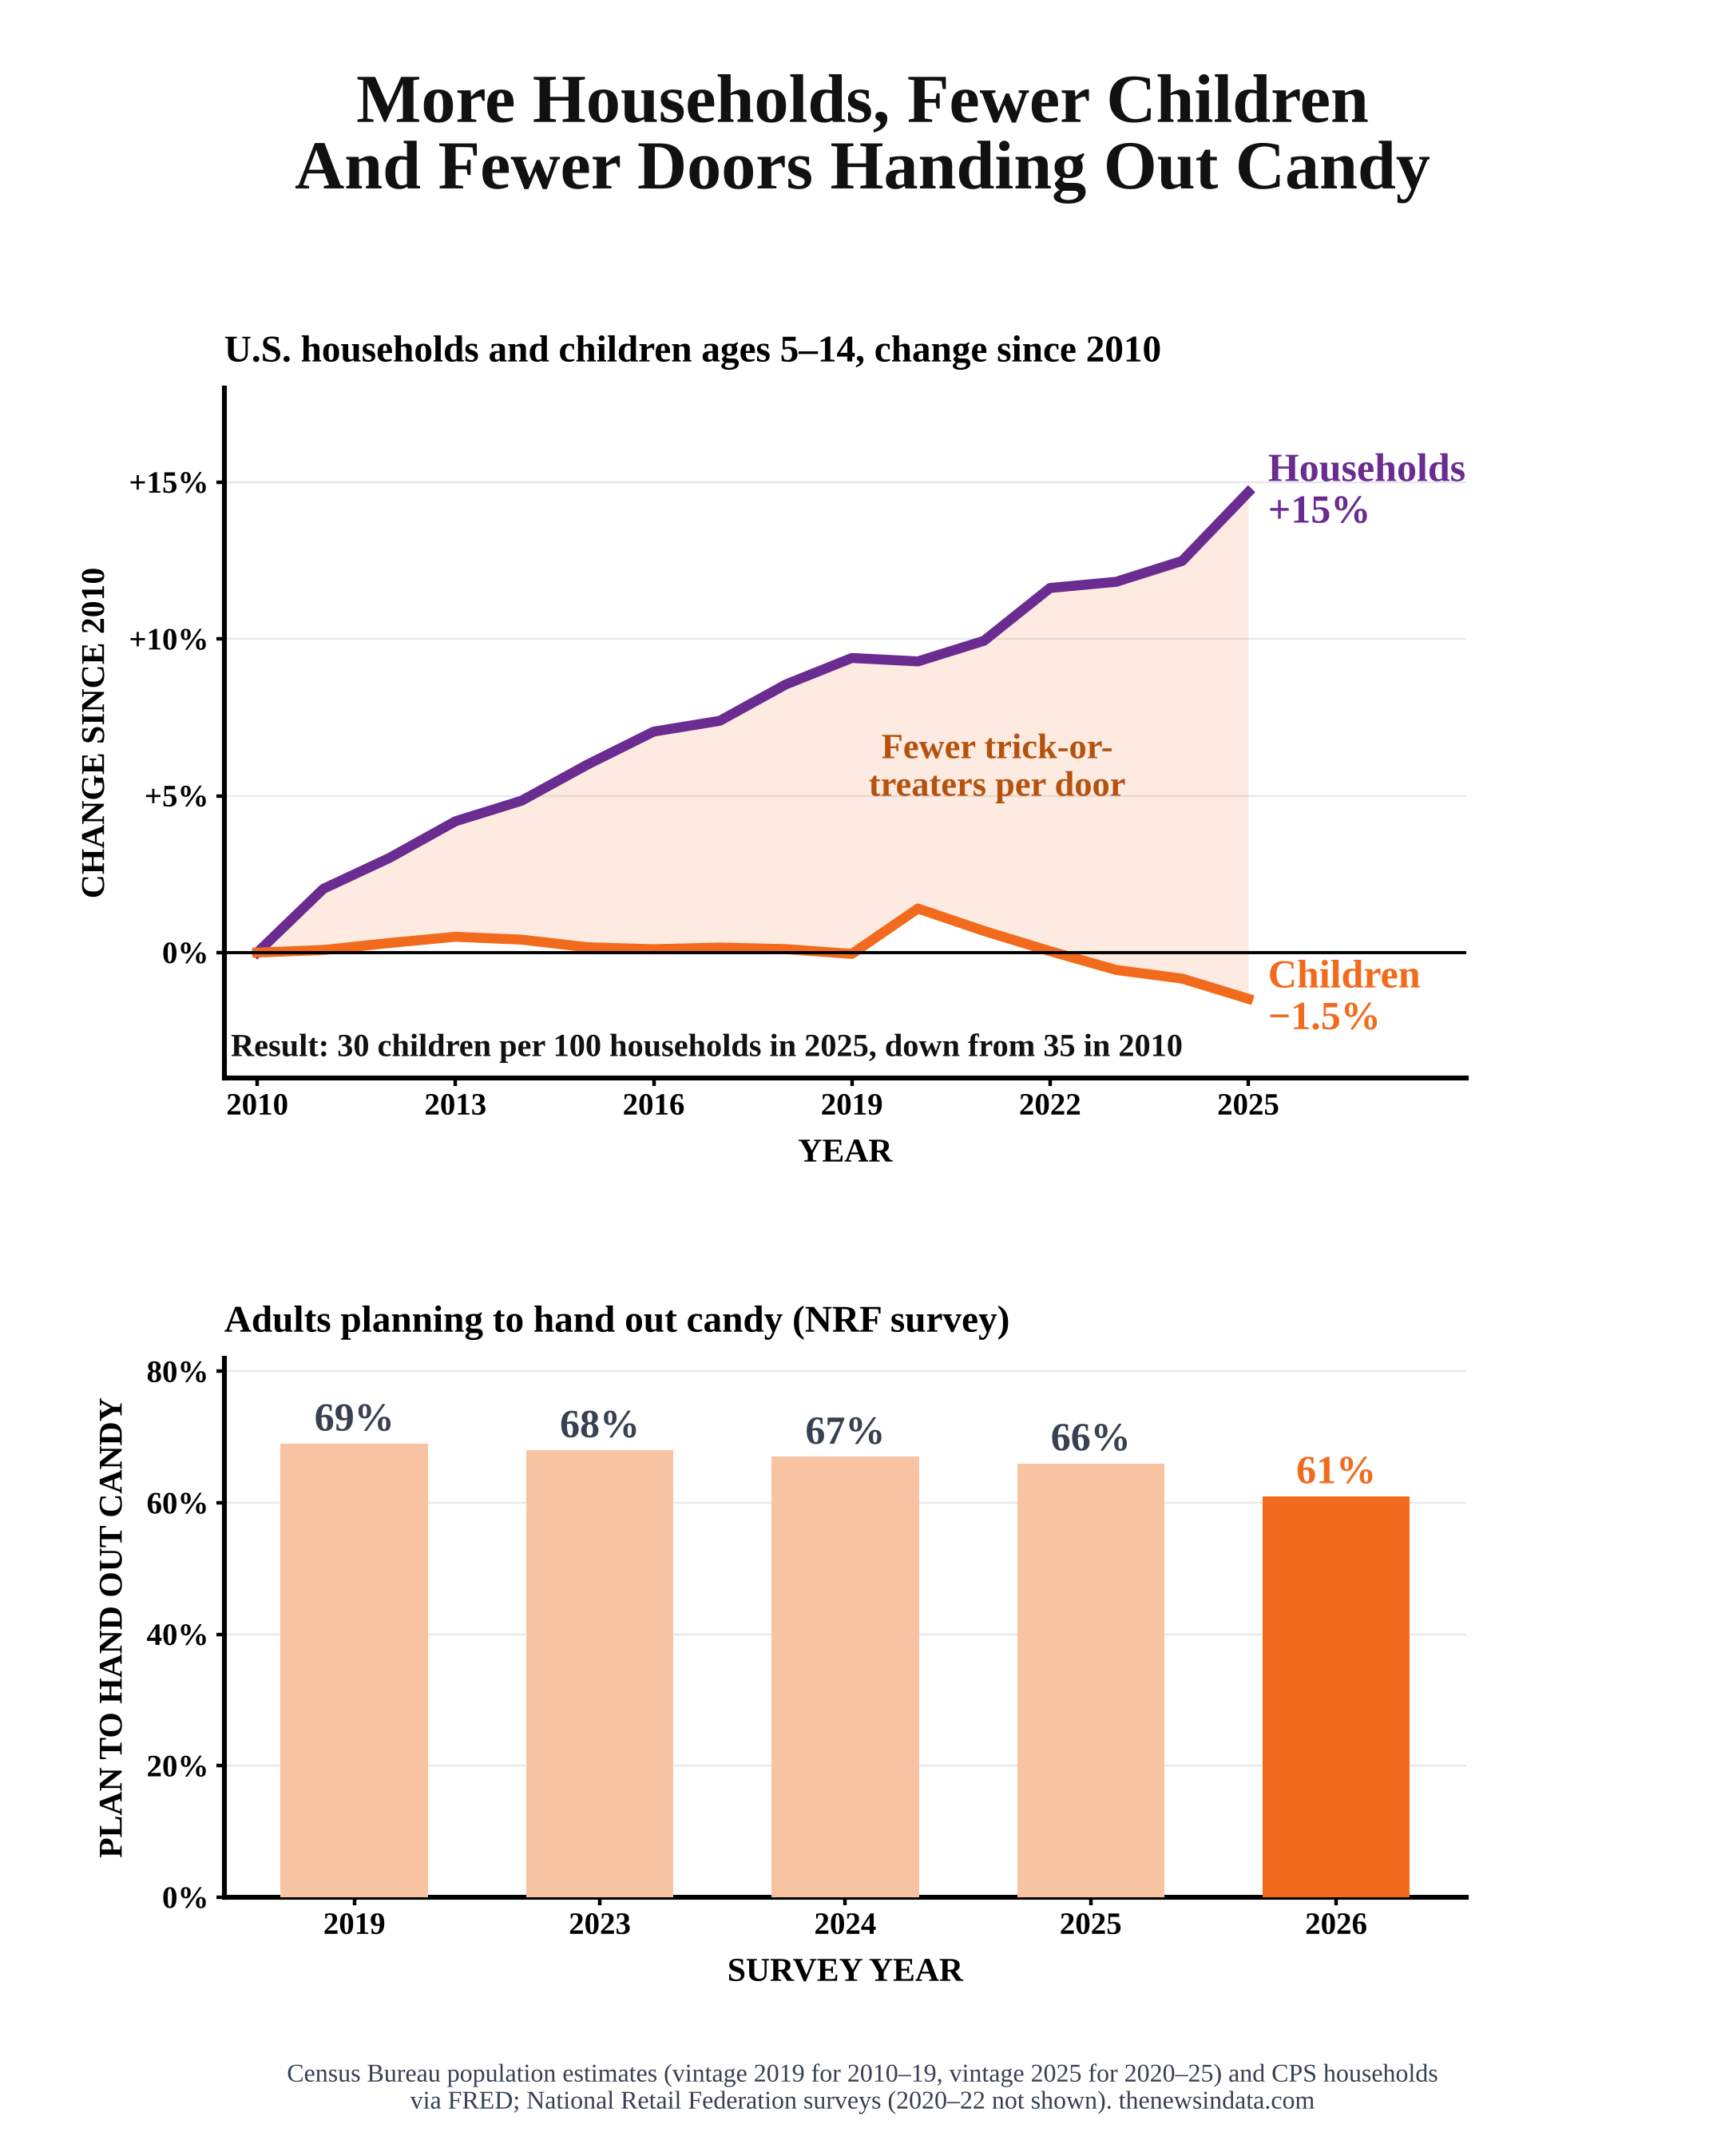
The United States had 30 children ages 5 to 14, the group the Census Bureau calls potential trick-or-treaters, for every 100 households in 2025, down from 35 in 2010. The number of children has edged down while the number of households has grown by about 17 million, so each door can expect fewer knocks. Fewer people also plan to answer: 61% of adults in this year's National Retail Federation survey plan to hand out candy, down from 69% in 2019.
Fewer children, more households
There were about 40.4 million children ages 5 to 14 in 2025, roughly 1.2 million fewer than in 2020, according to Census Bureau population estimates, as lower birth rates since 2008 move through the age group. The number of households grew from 117.5 million in 2010 to 134.8 million in 2025. Households have grown far faster than the number of children, so more homes on a typical street have no trick-or-treaters of their own.


Fewer doors with a candy bowl
The share of people planning to hand out candy in the retail federation's surveys was 69% in 2019, 68% in 2023, 67% in 2024 and 66% in 2025, then fell to 61% this year. An AP-NORC poll in October 2025 found that about one in five adults planned to take children trick-or-treating. Trick-or-treating also happens in more places than it used to, from trunk-or-treat events in church and school parking lots to shopping malls, which household counts don't capture.
Spending is still a record
Americans plan to spend a record $13.5 billion on Halloween this year, up from $13.1 billion in 2025, including $4.1 billion on candy, according to the retail federation. Ninety-six percent of those celebrating plan to buy candy, and the share celebrating rose to 74% from 68% in 2019. Candy costs more, too: the consumer price index for candy and chewing gum was 7.7% higher in September than a year earlier.


Each state's favorite candy
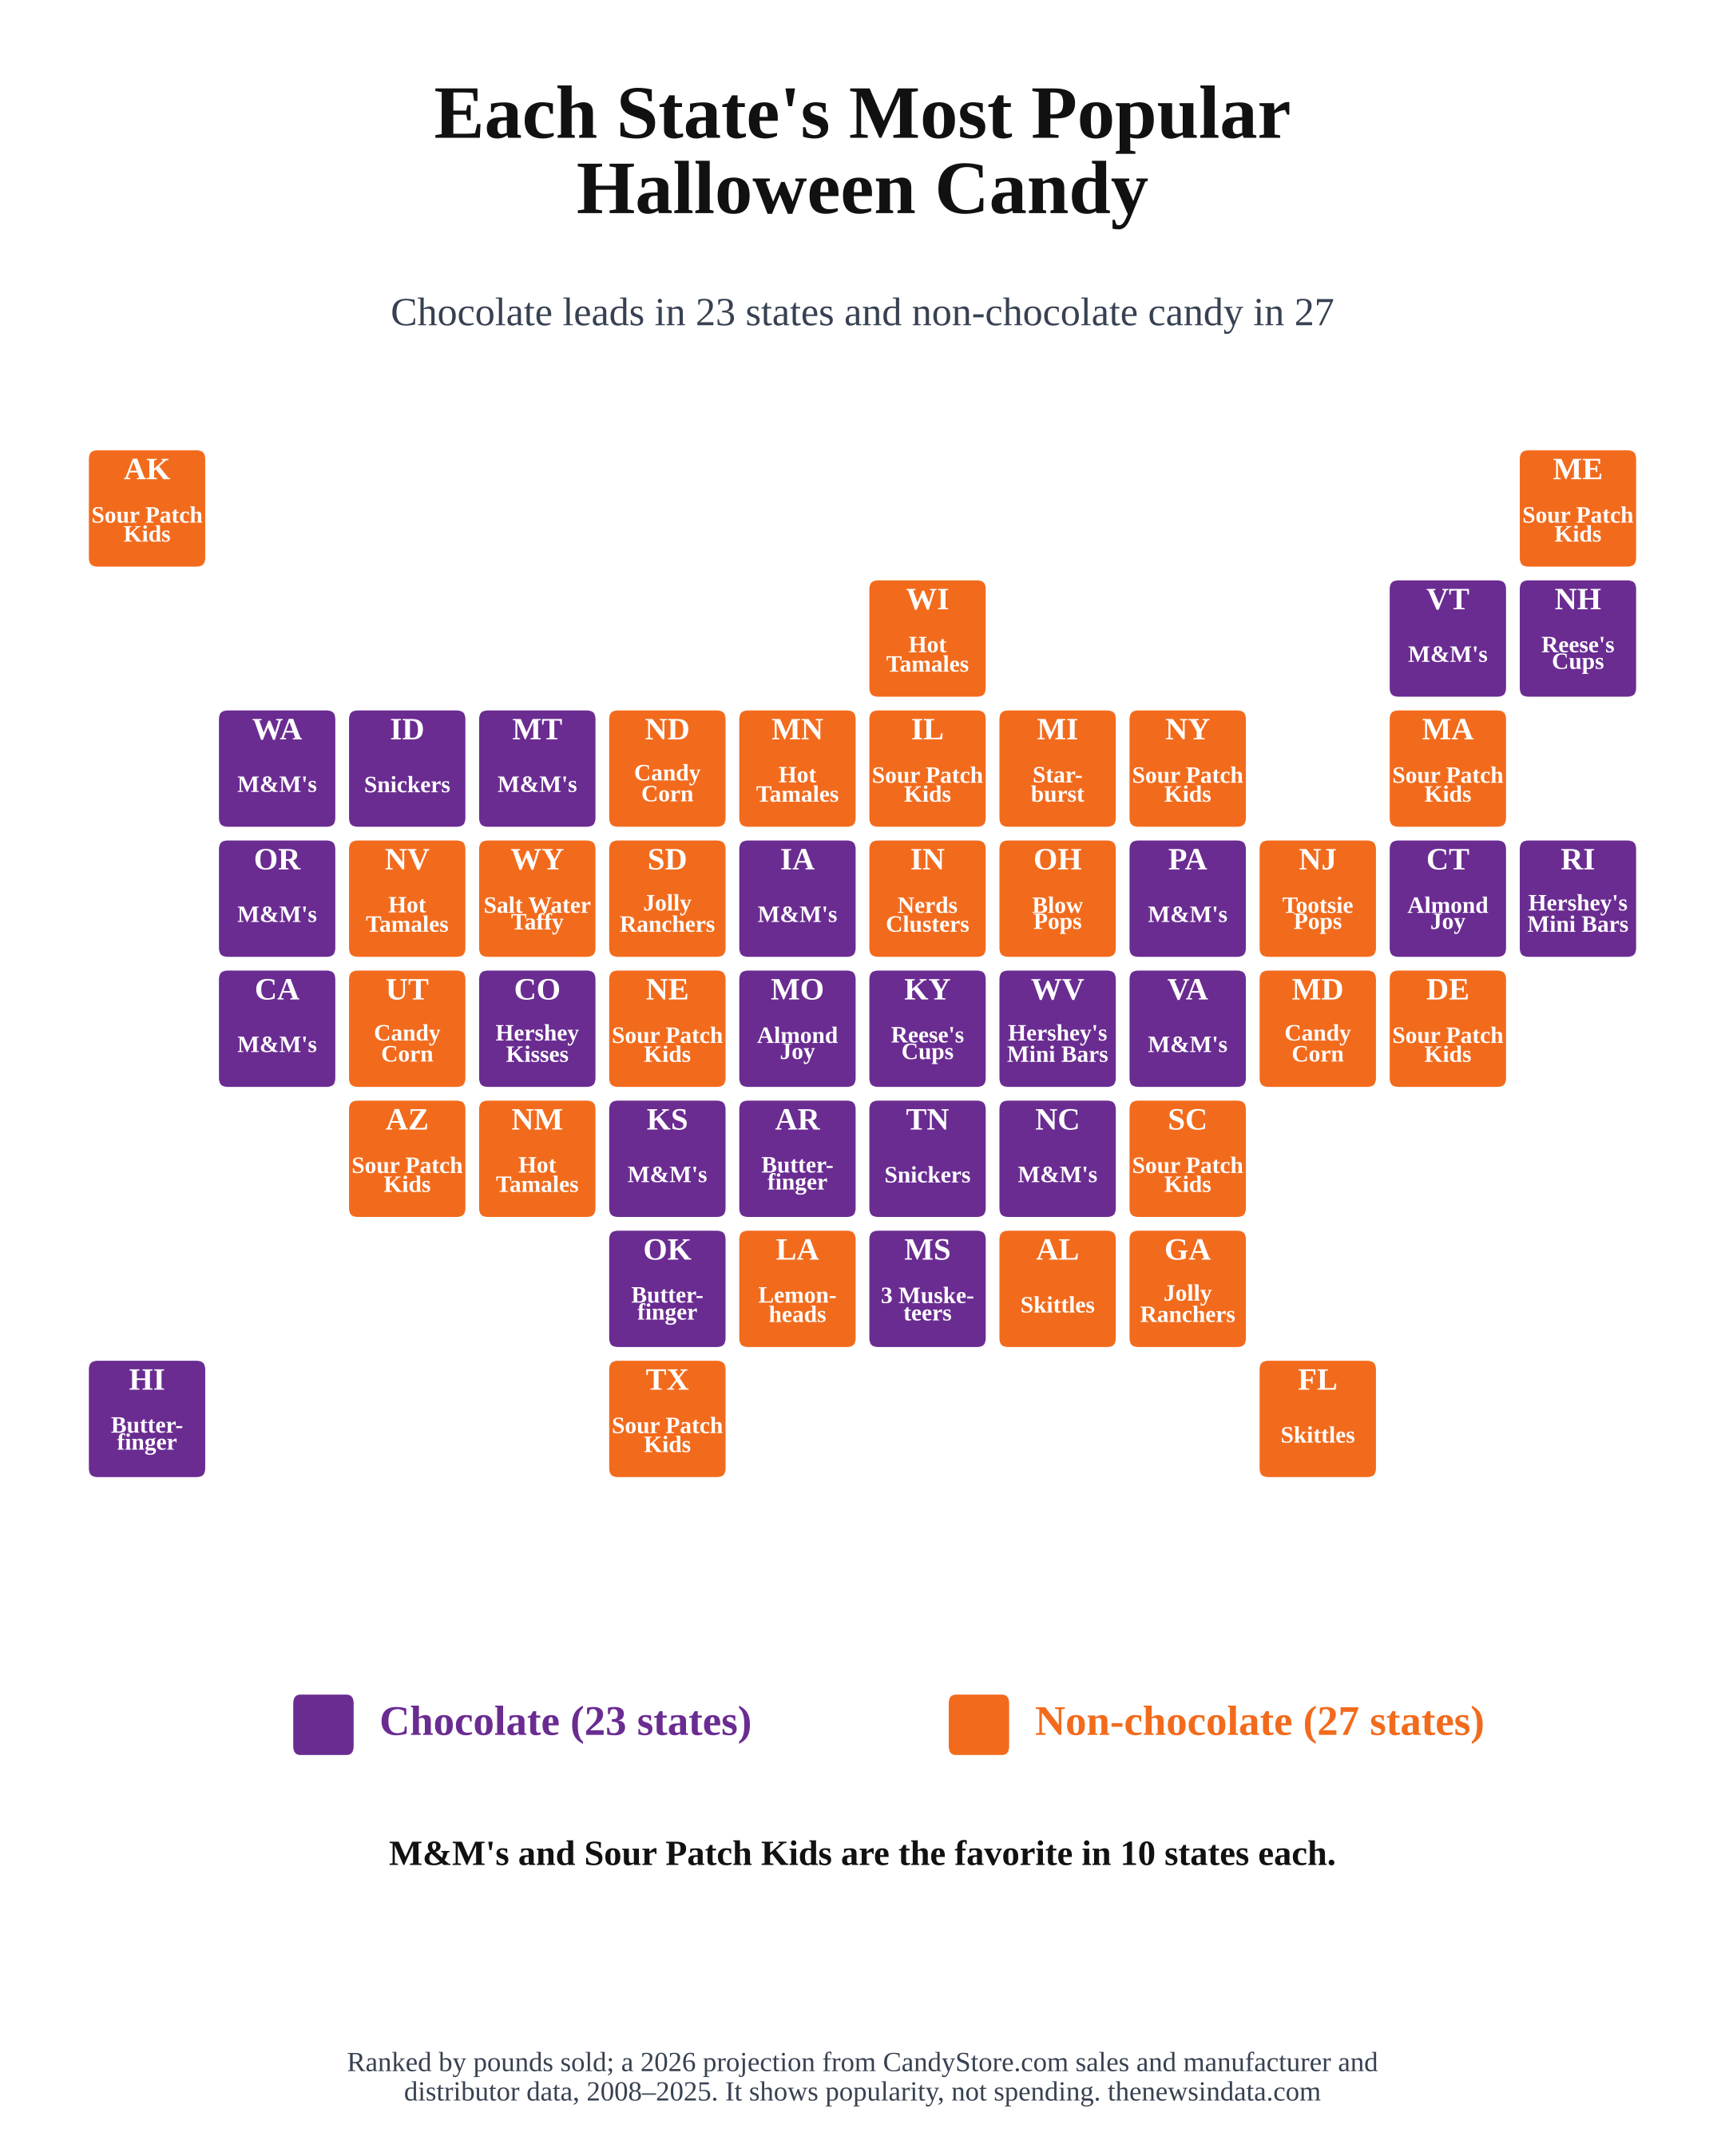
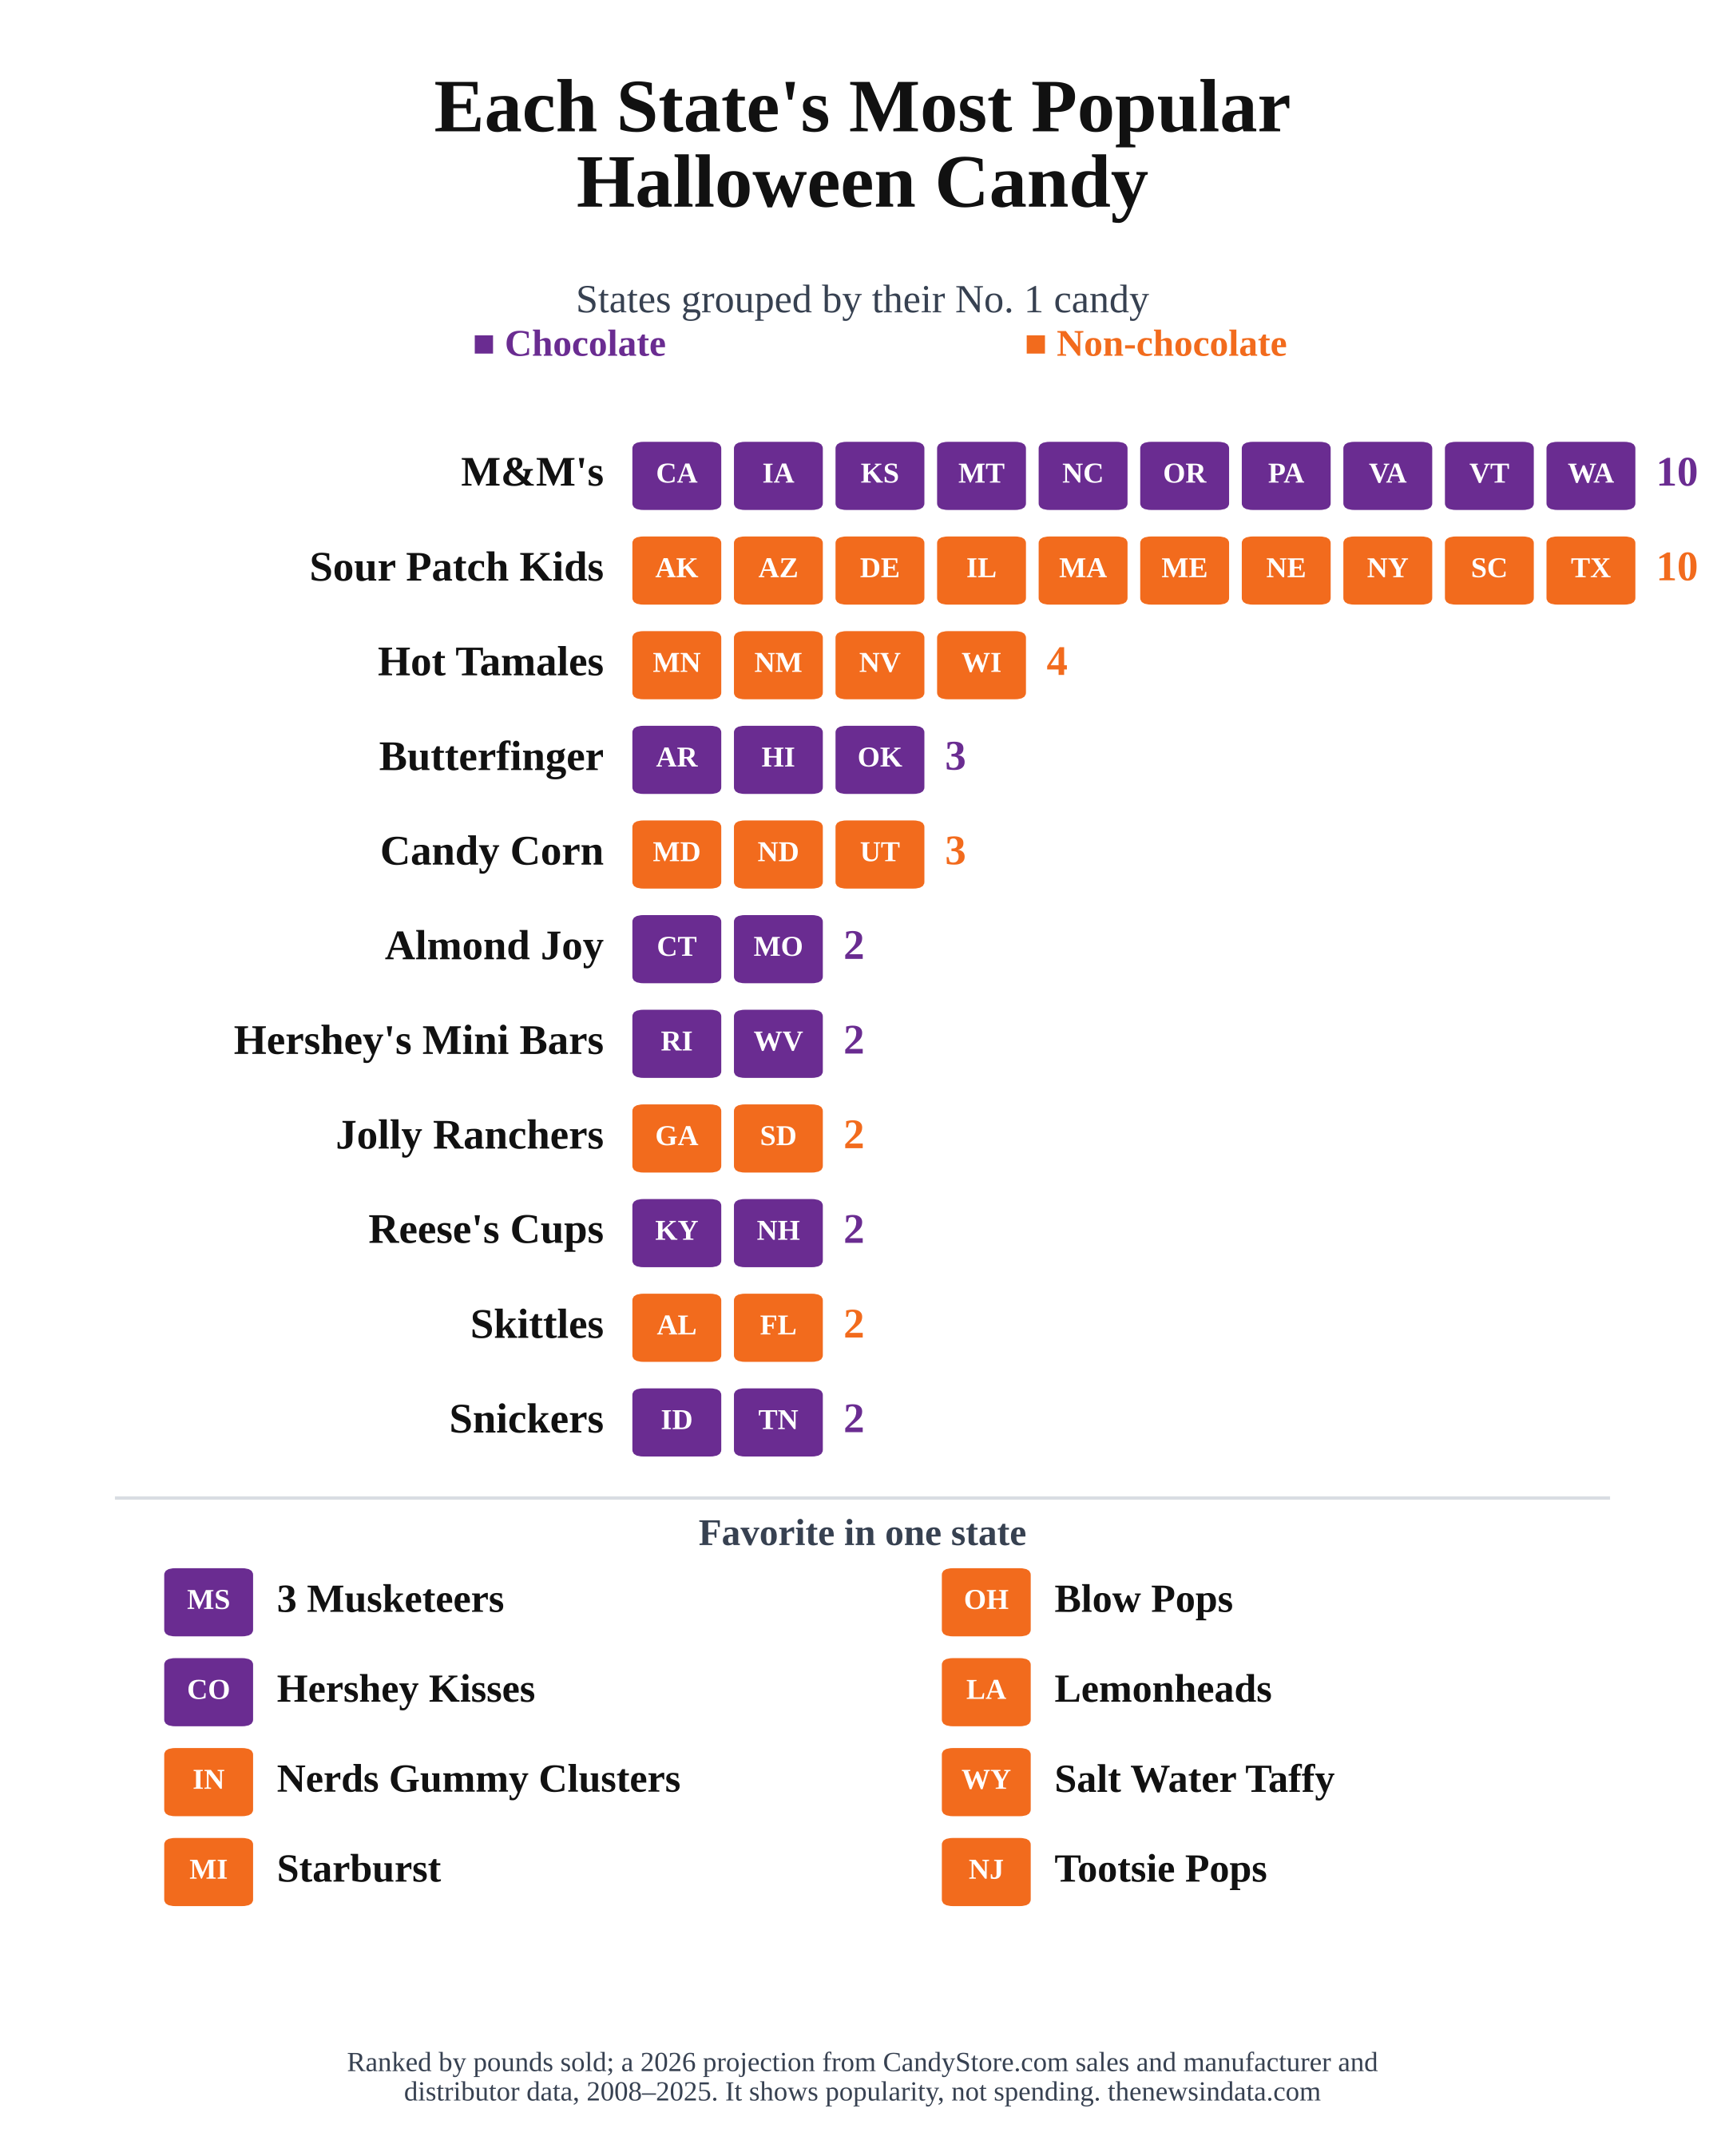
No government agency or trade group publishes Halloween spending by state, so the map shows the next best thing, each state's most popular Halloween candy by pounds sold, from CandyStore.com. M&M's and Sour Patch Kids lead 10 states each, and a non-chocolate candy is the favorite in 27 states. Utah, Maryland and North Dakota pick candy corn, Ohio picks Blow Pops and Wyoming picks salt water taffy.
Tap the chart to switch between the map and the states grouped by candy.
Forty years of candy spending, region by region
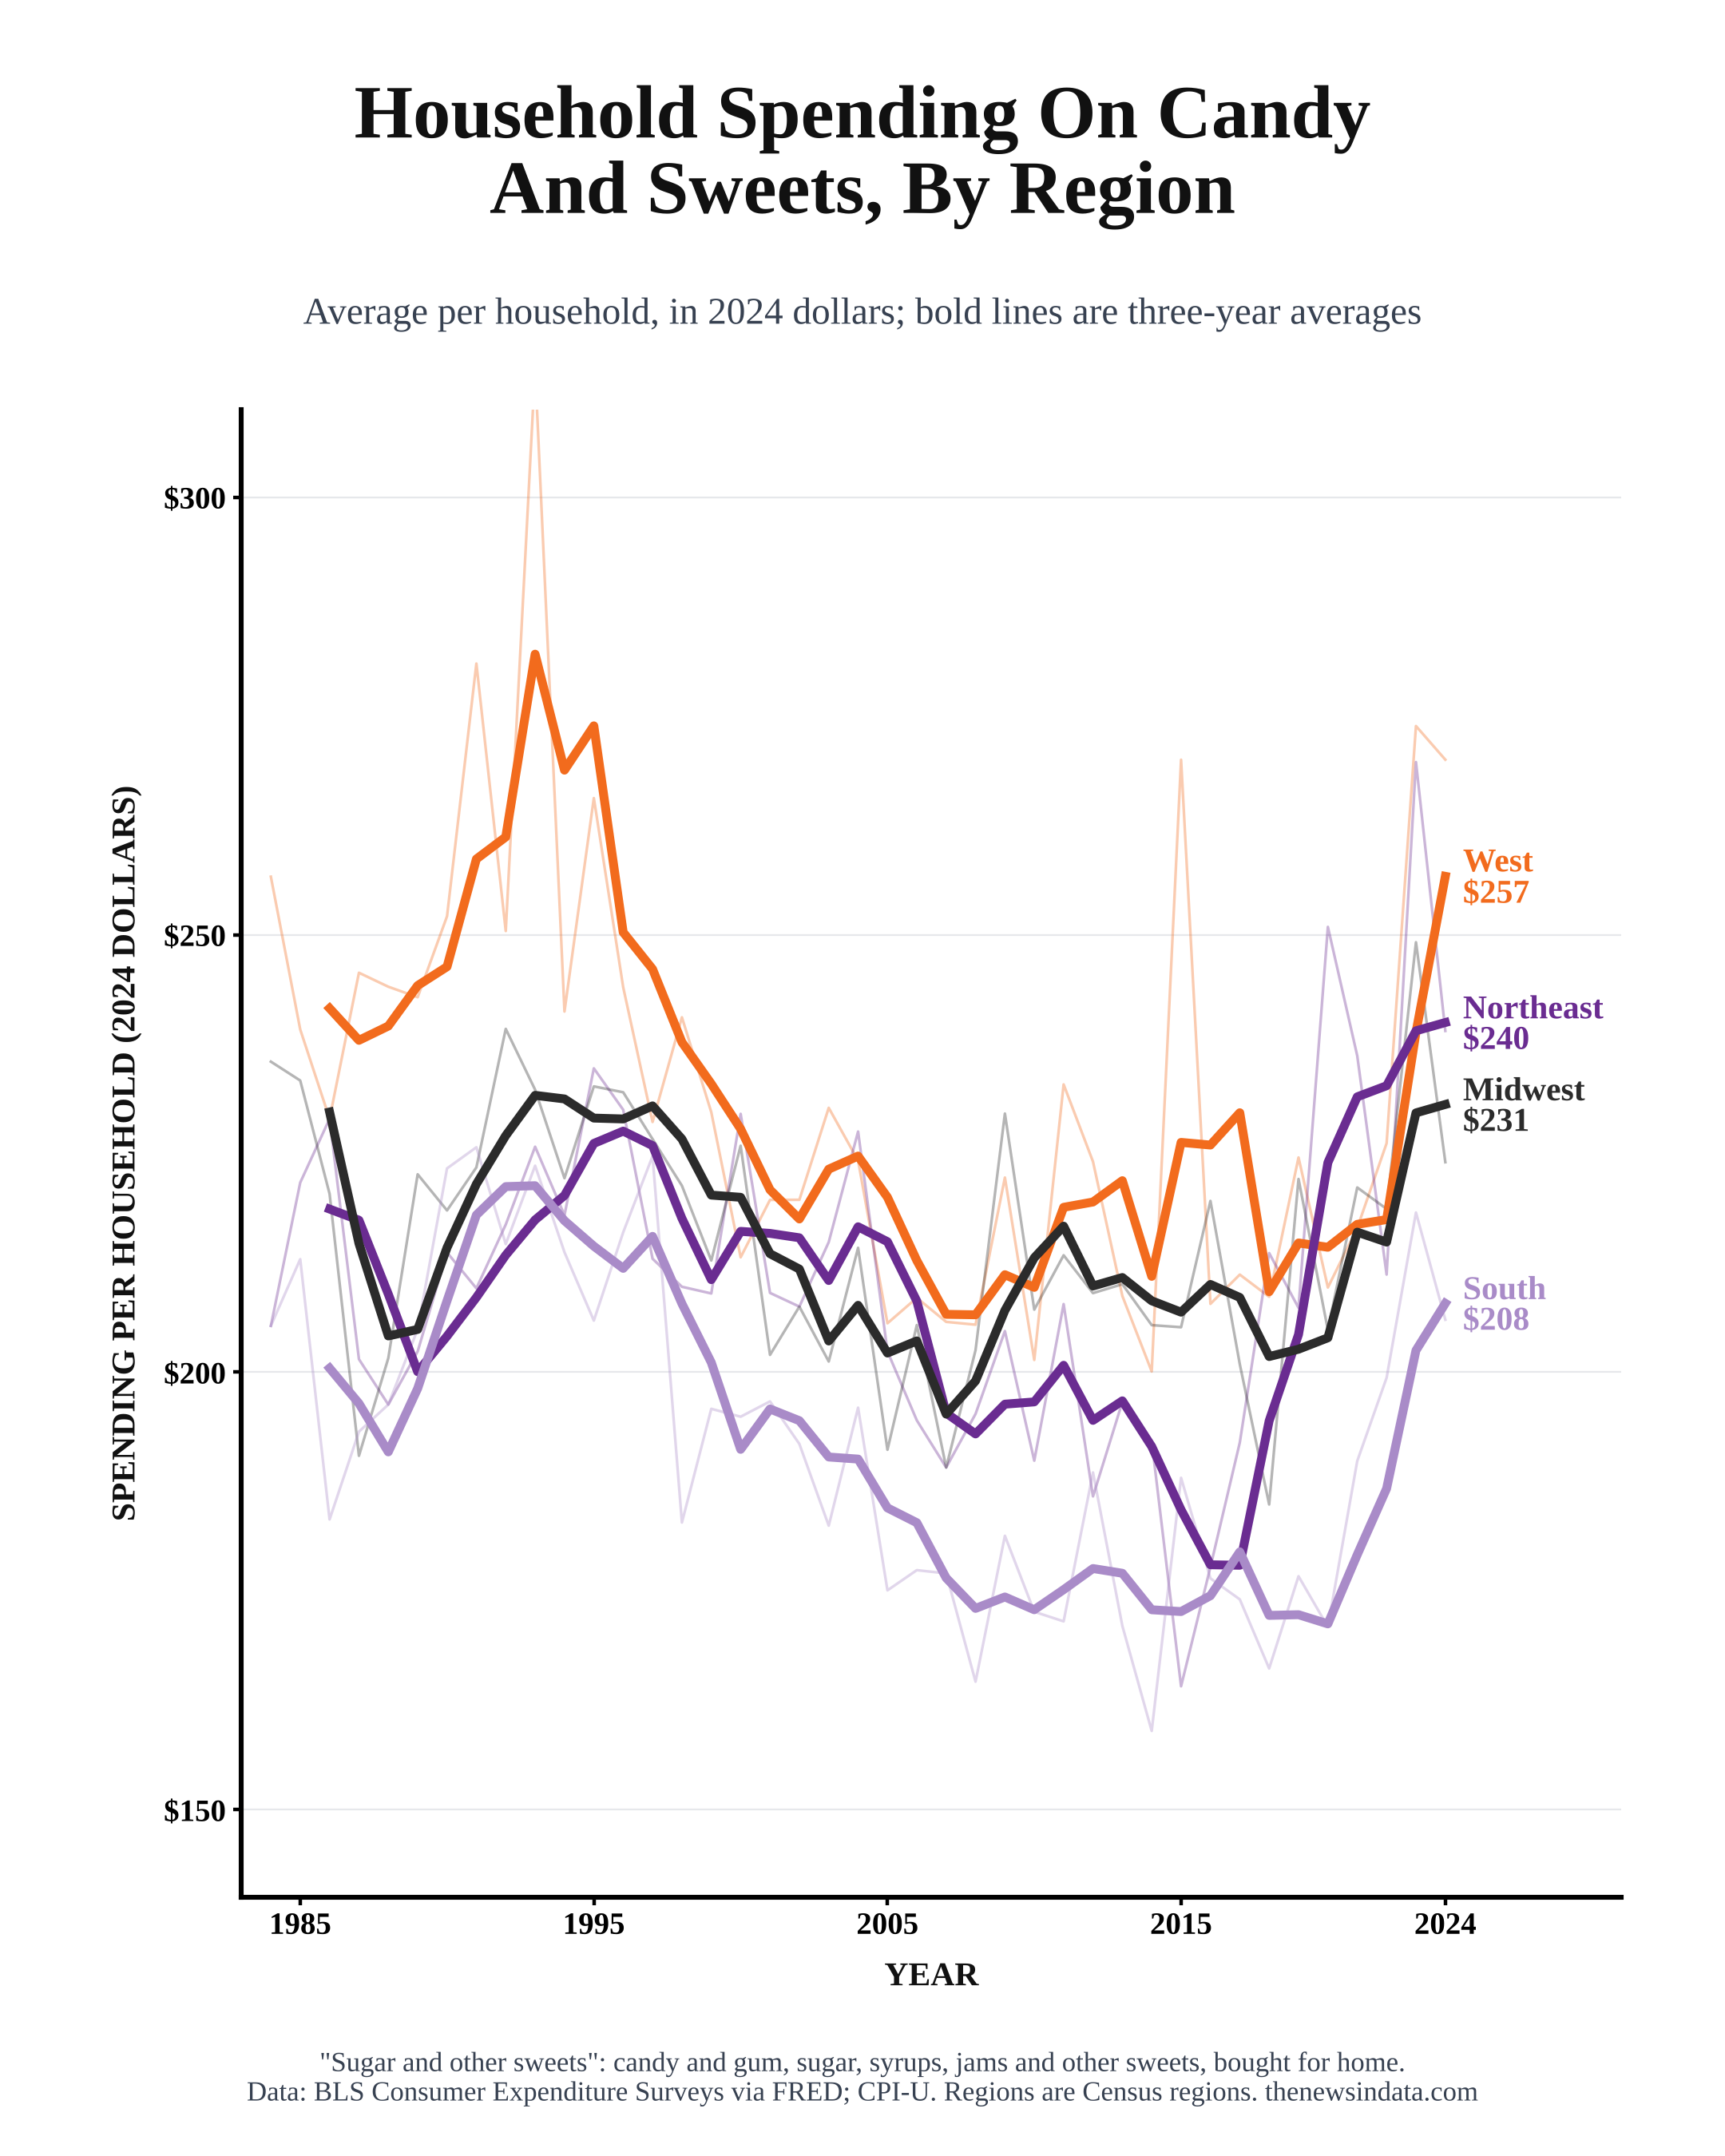
The Bureau of Labor Statistics tracks what households spend on "sugar and other sweets," mostly candy and gum, by region. After adjusting for inflation, spending in every region drifted down from the mid-1990s to the late 2010s, then rose quickly in the 2020s. Western households spend the most, an average of $257 a year over 2022 to 2024 in 2024 dollars, and Southern households the least, $208.
Spider-Man and witches lead the costumes
About 4.6 million children plan to dress as Spider-Man, twice as many as the next costume, a generic superhero. Witch is the top adult costume at 4.8 million, followed by vampire at 4.2 million.
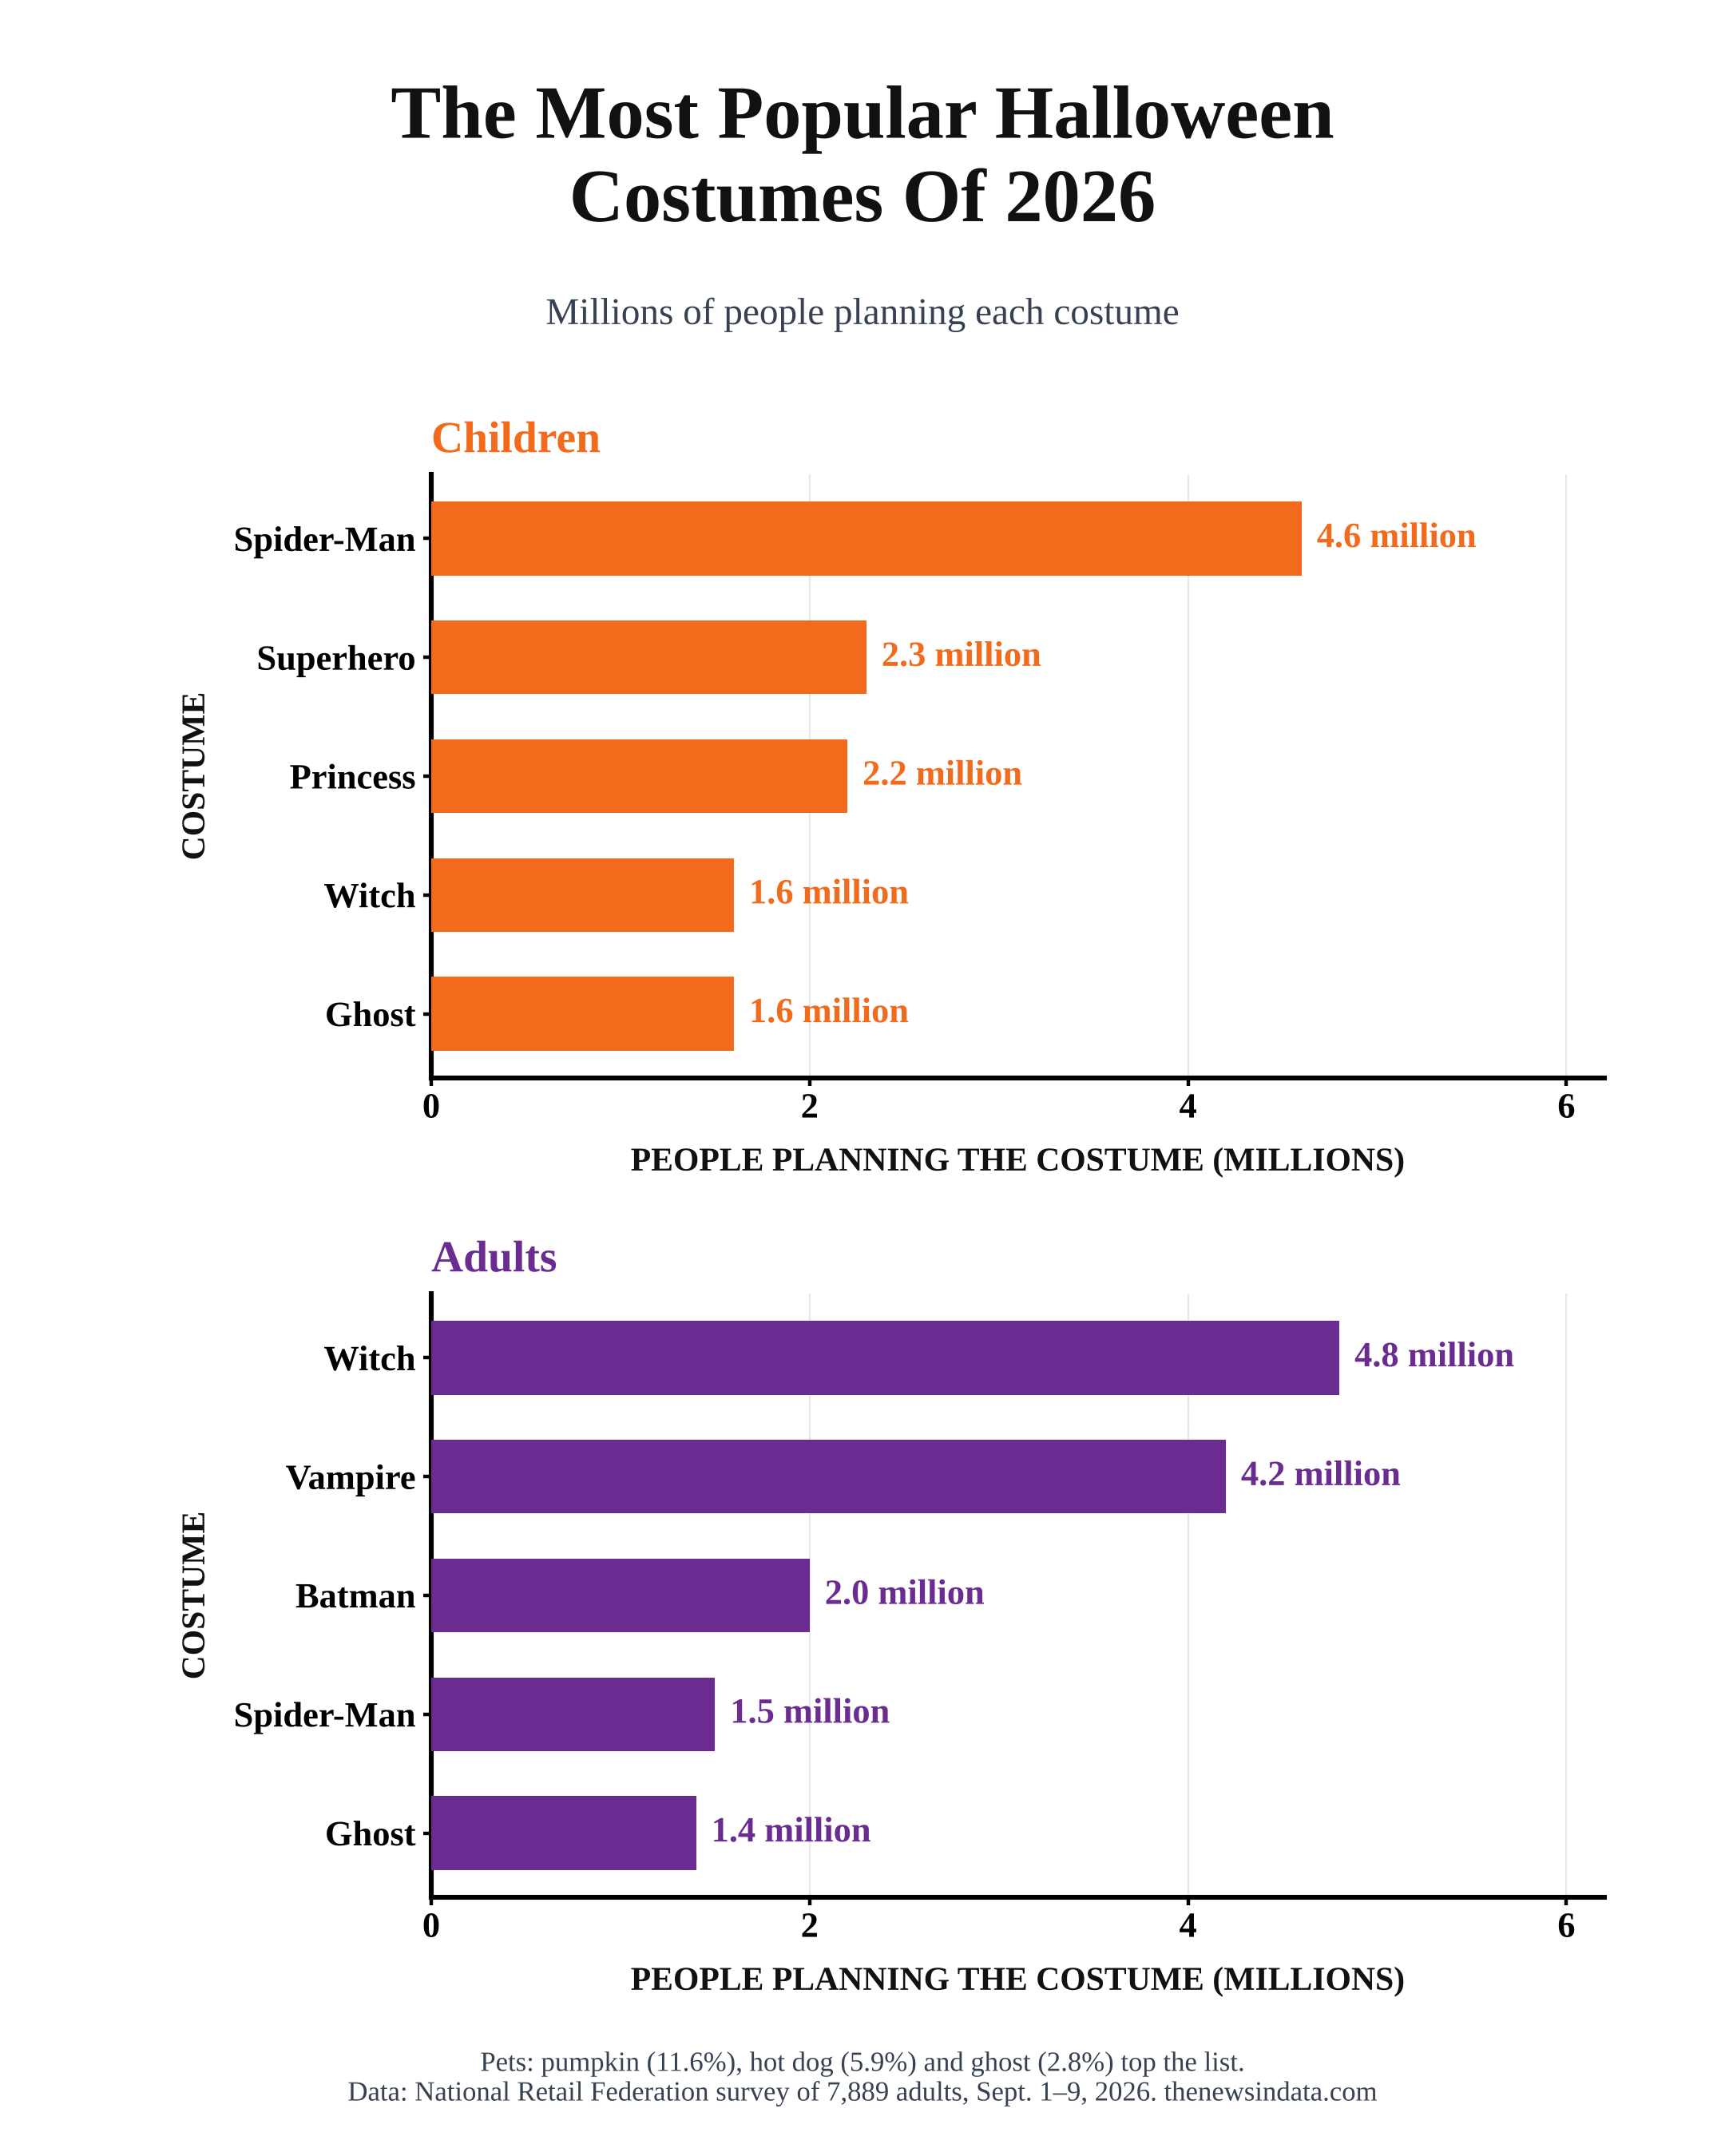
Pets get costumes too. Pumpkin is the most popular pet costume, chosen by 11.6% of people dressing up a pet, followed by hot dog at 5.9%.


What the data can't tell us
No national survey counts trick-or-treaters, so children ages 5 to 14 per household is a measure of how many could come, not how many do. The Census Bureau revised its population estimates after the 2020 census, so the 2010–2019 and 2020–2025 numbers come from different series and can't be compared exactly across 2019 and 2020. The retail federation's surveys ask about plans in early September and don't report every year's activities on the same basis. The candy map ranks popularity, not dollars spent.
How we counted: children ages 5 to 14 are July 1 resident population estimates from the Census Bureau (vintage 2019 for 2010–2019, vintage 2025 for 2020–2025); households are from the Census Bureau's Current Population Survey via FRED. Candy plans are from National Retail Federation surveys for 2019 and 2023–2026; 2020–2022 are not shown. Regional sweets spending is the BLS Consumer Expenditure Surveys "sugar and other sweets" series via FRED, adjusted to 2024 dollars with the CPI-U annual average. Sources: NRF, Sept. 22, 2026; NRF 2025 survey; NRF 2023 survey; Census population estimates; FRED total households; FRED regional sweets spending; BLS candy CPI; CandyStore.com; AP-NORC, Oct. 2025.