Women Earned 86% Of What Men Earned In 2025, And Each Group Of Women Falls Further Behind As It Ages
Scroll through the interactive version of this story →
Women earned 86% as much as men in 2025, comparing median hourly earnings, according to a Pew Research Center report published Oct. 22. That is up from 78% in 2000 and 65% in 1982, the first year in Pew's series.
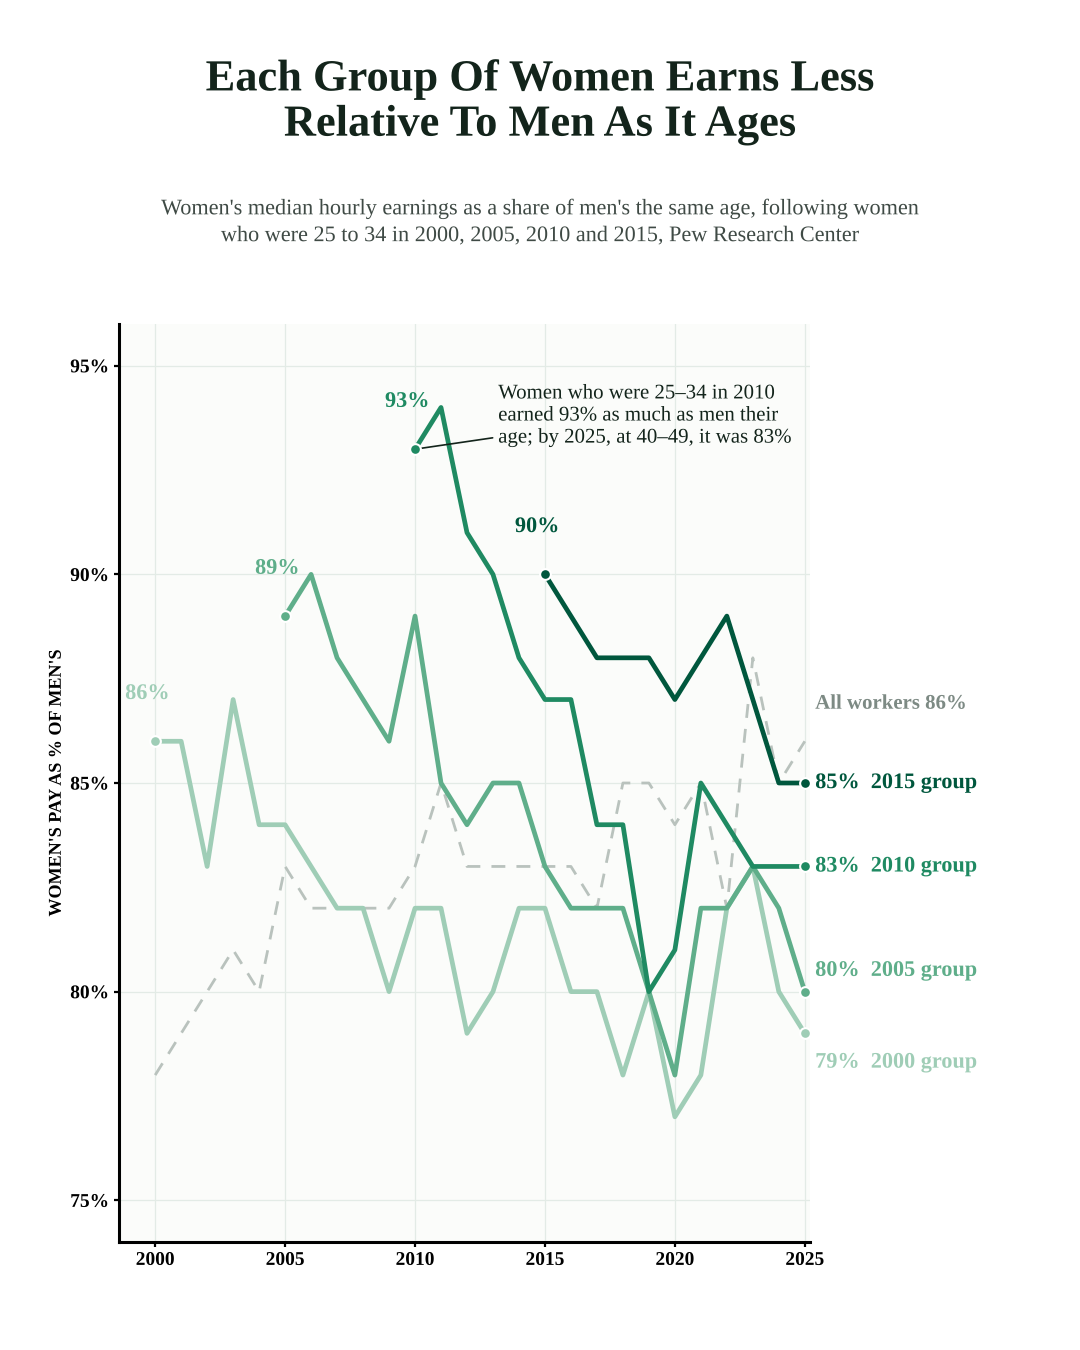
The gap opens as women get older
Pew followed four groups of women who were 25 to 34 in 2000, 2005, 2010 and 2015, comparing each with men of the same age every year since. Women who were 25 to 34 in 2010 earned 93% as much as men their age that year and 83% in 2025, when they were 40 to 49, a drop of 10 points. The 2005 group fell from 89% to 80%, the 2000 group from 86% to 79%, and the 2015 group, followed for 10 years so far, from 90% to 85%.
Why the overall figure still rose
The 86% for all workers mixes every age, while each line in the chart follows one group as it ages. The three newer groups started at 89% or higher, above the 86% the 2000 group started at, which helps explain how the overall figure rose even as each group slipped relative to men its own age.
The gap widens in the parenting years
Pew's report sets the earnings data beside data on caregiving. In 2025, 74% of mothers with children under 18 were working or looking for work, compared with 94% of fathers. Among parents who work full time, 52% of mothers said being a parent makes it harder to advance at work, compared with 38% of fathers, and 67% of working mothers said they couldn't give 100% at home, compared with 50% of working fathers.
Caregiving continues after children grow up
Some 28% of women care for a parent, spouse or partner 65 or older, compared with 23% of men, according to the report. Among people caring for a parent, 40% of women said it hurt their emotional well-being, compared with 22% of men, and 36% of women said it hurt their finances, compared with 22% of men.
What the data can't tell us
The comparison is of median hourly pay and doesn't adjust for occupation, hours or years of experience, so it measures the size of the gap rather than its causes. Single-year figures for each group move by several points (the 2005 group went from 89% to 85% between 2010 and 2011), so the change from start to finish is a better guide than any one year. The 2015 group is now 35 to 44, and the next few years will show whether it follows the path of the groups before it.
How we counted: all figures are from Pew Research Center's "Women, Work and Caregiving Through the Arc of Family Life," Oct. 22, 2026. Pew's pay comparisons use median hourly earnings of employed workers 16 and older, full- and part-time, from the Census Bureau's monthly Current Population Survey, excluding the self-employed, the method it describes in its earlier pay-gap analyses. Each group compares women who were 25 to 34 in the starting year with men of the same age in each later year. Sources: Pew Research Center, Oct. 22, 2026; Pew method, March 2023.
You may republish the charts in this story, with credit to The News in Data and a link to this story.