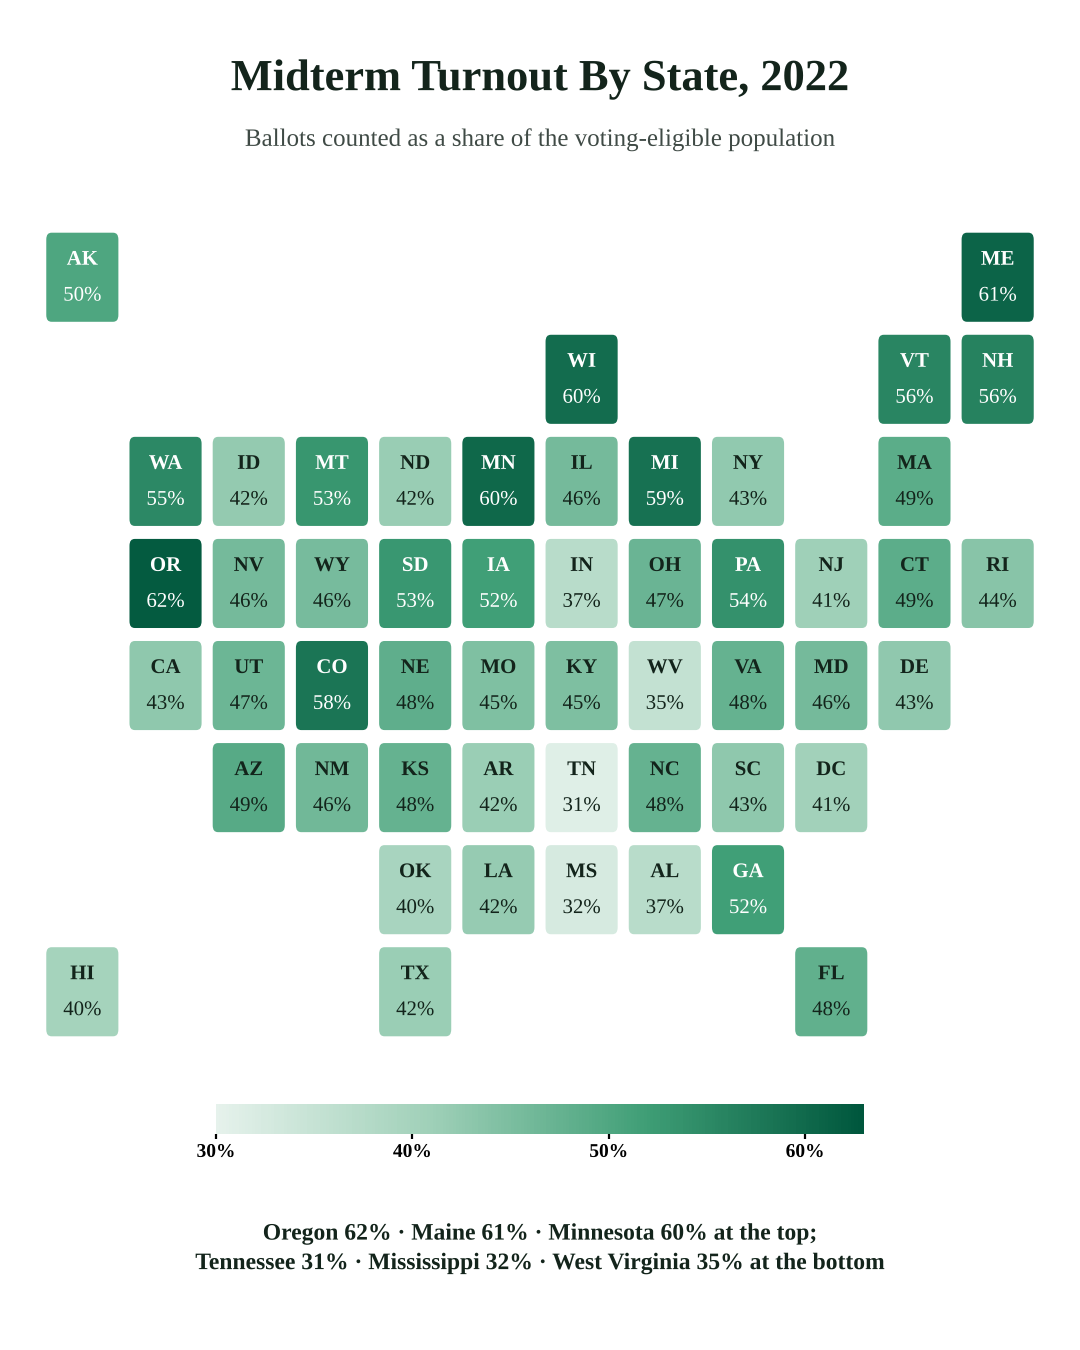
Midterm Turnout In 2022 Ranged From 31% In Tennessee To 62% In Oregon
Scroll through the interactive version of this story →
About 46% of eligible Americans voted in the 2022 midterms, according to the University of Florida Election Lab, but the rate varied by more than 30 points between states. Oregon led at 62.3%, followed by Maine at 60.8% and Minnesota at 60.4%, while Tennessee was lowest at 31.0%, followed by Mississippi at 32.5% and West Virginia at 35.4%.
2018 was the high point
Midterm turnout reached 50.1% in 2018, the highest since 1914, and fell to 46.1% in 2022, according to the Election Lab's national series. The rate dropped in 42 of 50 states, by the most in North Dakota (58.7% to 41.7%), Tennessee (45.1% to 31.0%) and New Jersey (53.7% to 41.1%). It rose in eight states, by the most in Pennsylvania (51.8% to 53.9%), New Hampshire and Arizona.
Older voters are a bigger share than their population
Adults 65 and older made up 30.4% of 2022 midterm voters but 23.8% of voting-age citizens, according to the Census Bureau's survey of voters, while adults 18 to 29 made up 11.7% of voters and 19.6% of voting-age citizens. Half of 2022 voters (49.8%) cast ballots early or by mail, 10 points more than in 2018, according to the same survey.
The long view
Midterm turnout fell below 40% in most midterms from 1974 through 2014, and 2014's 36.7% was the lowest since 1942. The 2018 and 2022 rates were the two highest midterm figures in more than 50 years.
What's next
States report final turnout in the weeks after Nov. 3, and the Election Lab usually publishes its state estimates by early the following year. The Census Bureau's survey of who voted in 2026 typically arrives about 18 months after the election.
How we counted: turnout is total ballots counted divided by the voting-eligible population (citizens 18 and older, excluding ineligible felons where applicable), from the University of Florida Election Lab's 2018 and 2022 state files and its national series (Walter Dean Burnham before 1948, Michael McDonald after). The 2022 state file's national rate is 45.99% and the national series gives 46.12%. Age shares are from the Census Bureau's Current Population Survey Voting and Registration Supplement, released April 23, 2024. Sources: UF Election Lab 2022; UF Election Lab 2018; UF national series; Census Bureau.
You may republish the charts in this story, with credit to The News in Data and a link to this story.