Canadian residents made 19.9 million return trips from the United States from January through August 2026, according to Statistics Canada's border and airport counts. That is 25% fewer than the 26.6 million in the same months of 2024, and about the same as 2025, when Canadians began avoiding U.S. travel after President Trump's tariffs and talk of making Canada the "51st state." Over the same months, their return trips from other countries rose 12%, to 10.2 million.
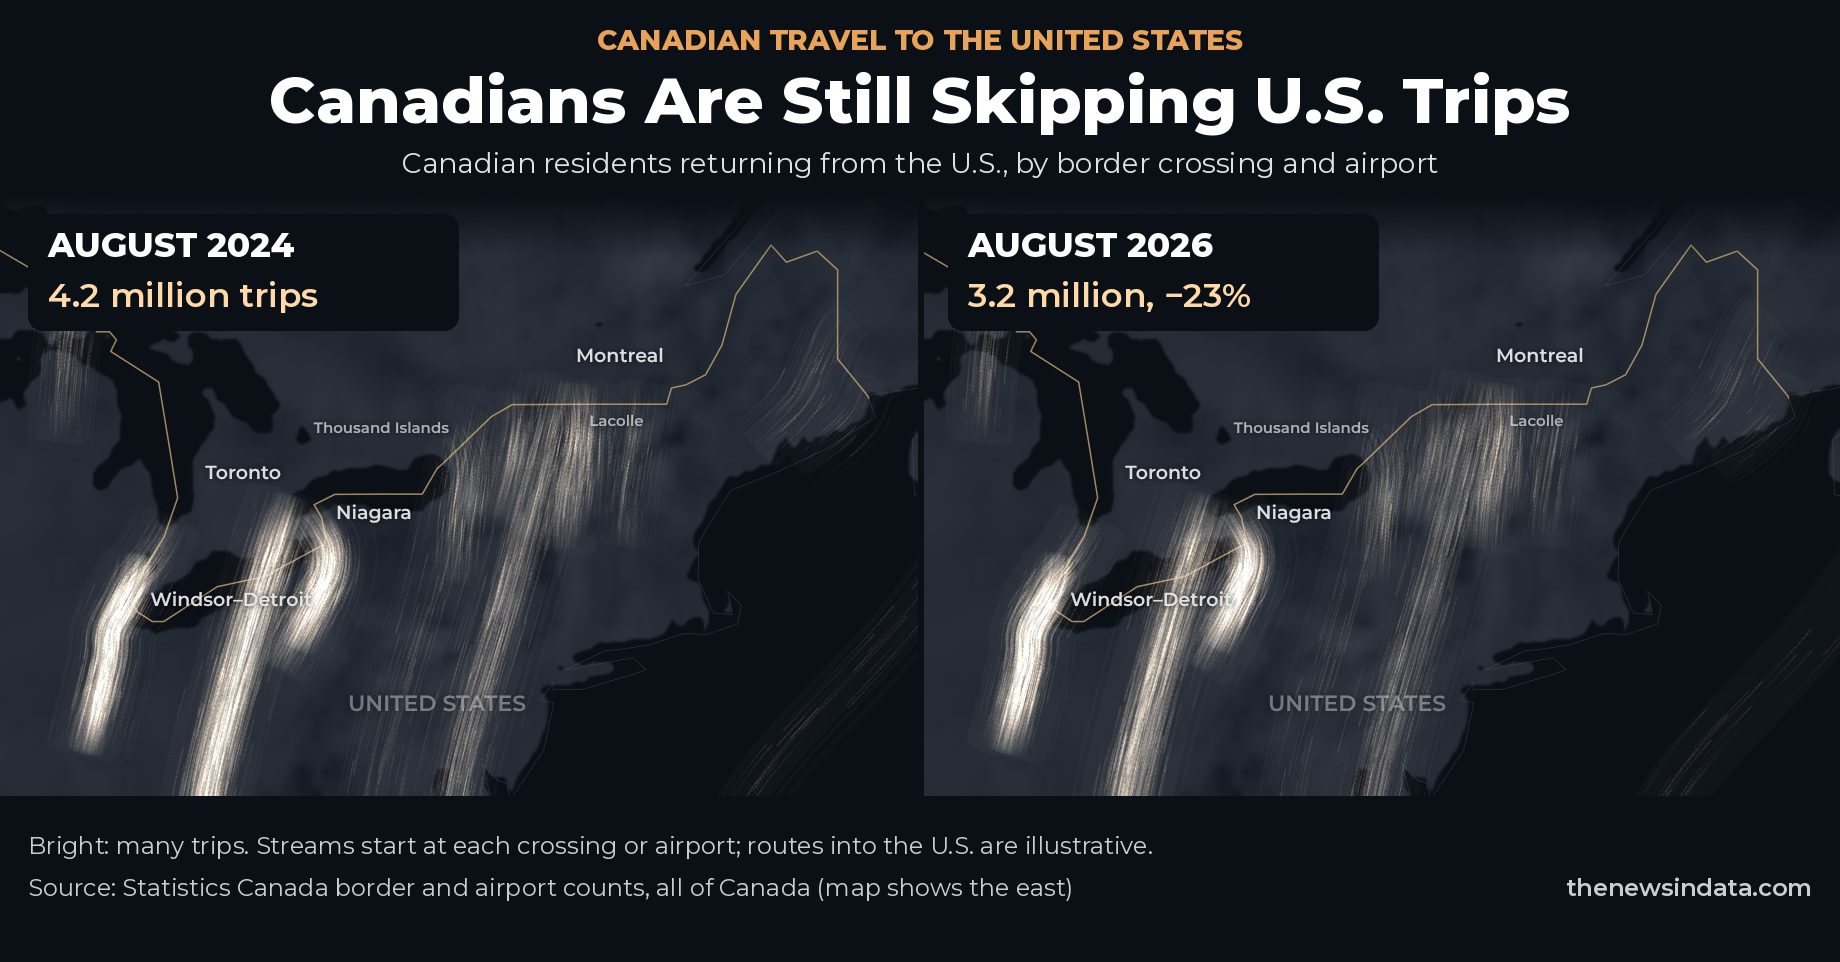
Press play to watch Canadian travel to the U.S. ebb and flow month by month across every major crossing and airport, from Vancouver to New Brunswick.
A partial comeback
Travel has picked up a little. Every month since April has topped the same month of 2025, and August's 3.2 million trips were 9% more than a year earlier. But every month this year is still 23% to 28% below the same month of 2024.
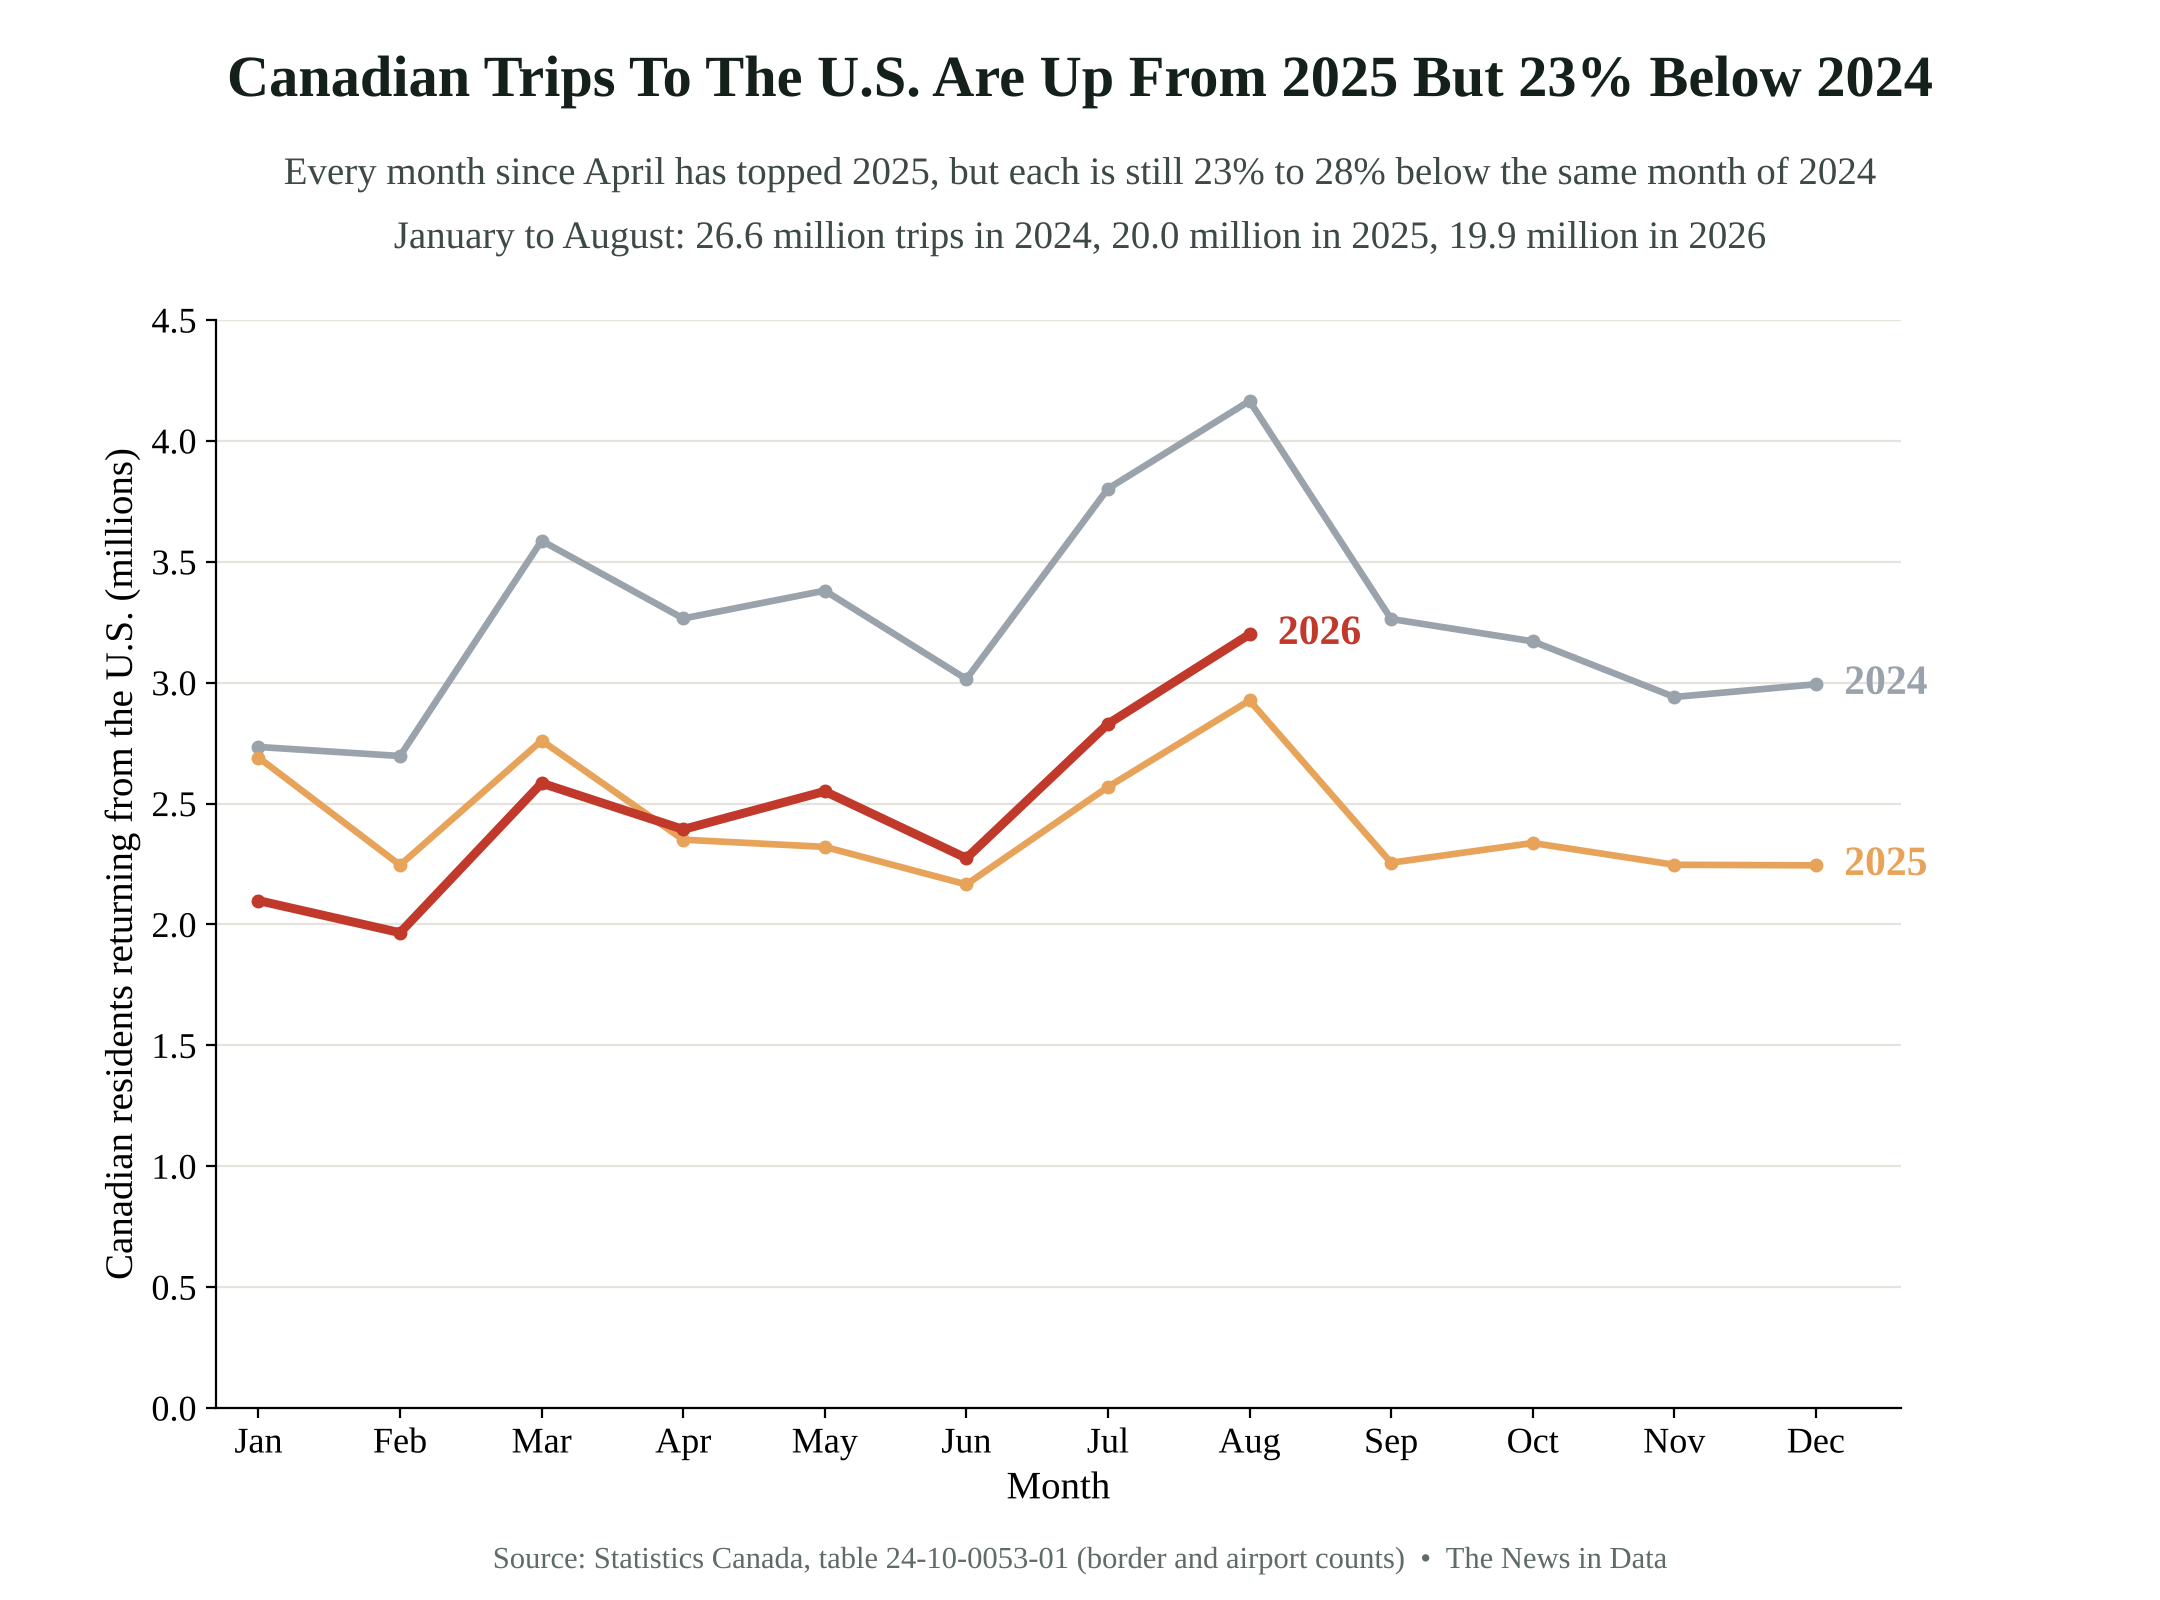
The drop is steepest on the road. Return trips by land fell 28% from January through August compared with 2024, while trips by air fell 16%.


Which crossings emptied out
The biggest declines were at crossings that serve vacation and shopping trips. Stanstead, on the Quebec–Vermont border, was down 44%. The Thousand Islands crossing at Lansdowne, Ont., was down 42%, Niagara Falls' Rainbow Bridge 41% and Lacolle, on the highway from Montreal to New York, 39%. The two main crossings between British Columbia and Washington, Pacific Highway and the Peace Arch, were both down more than a third.
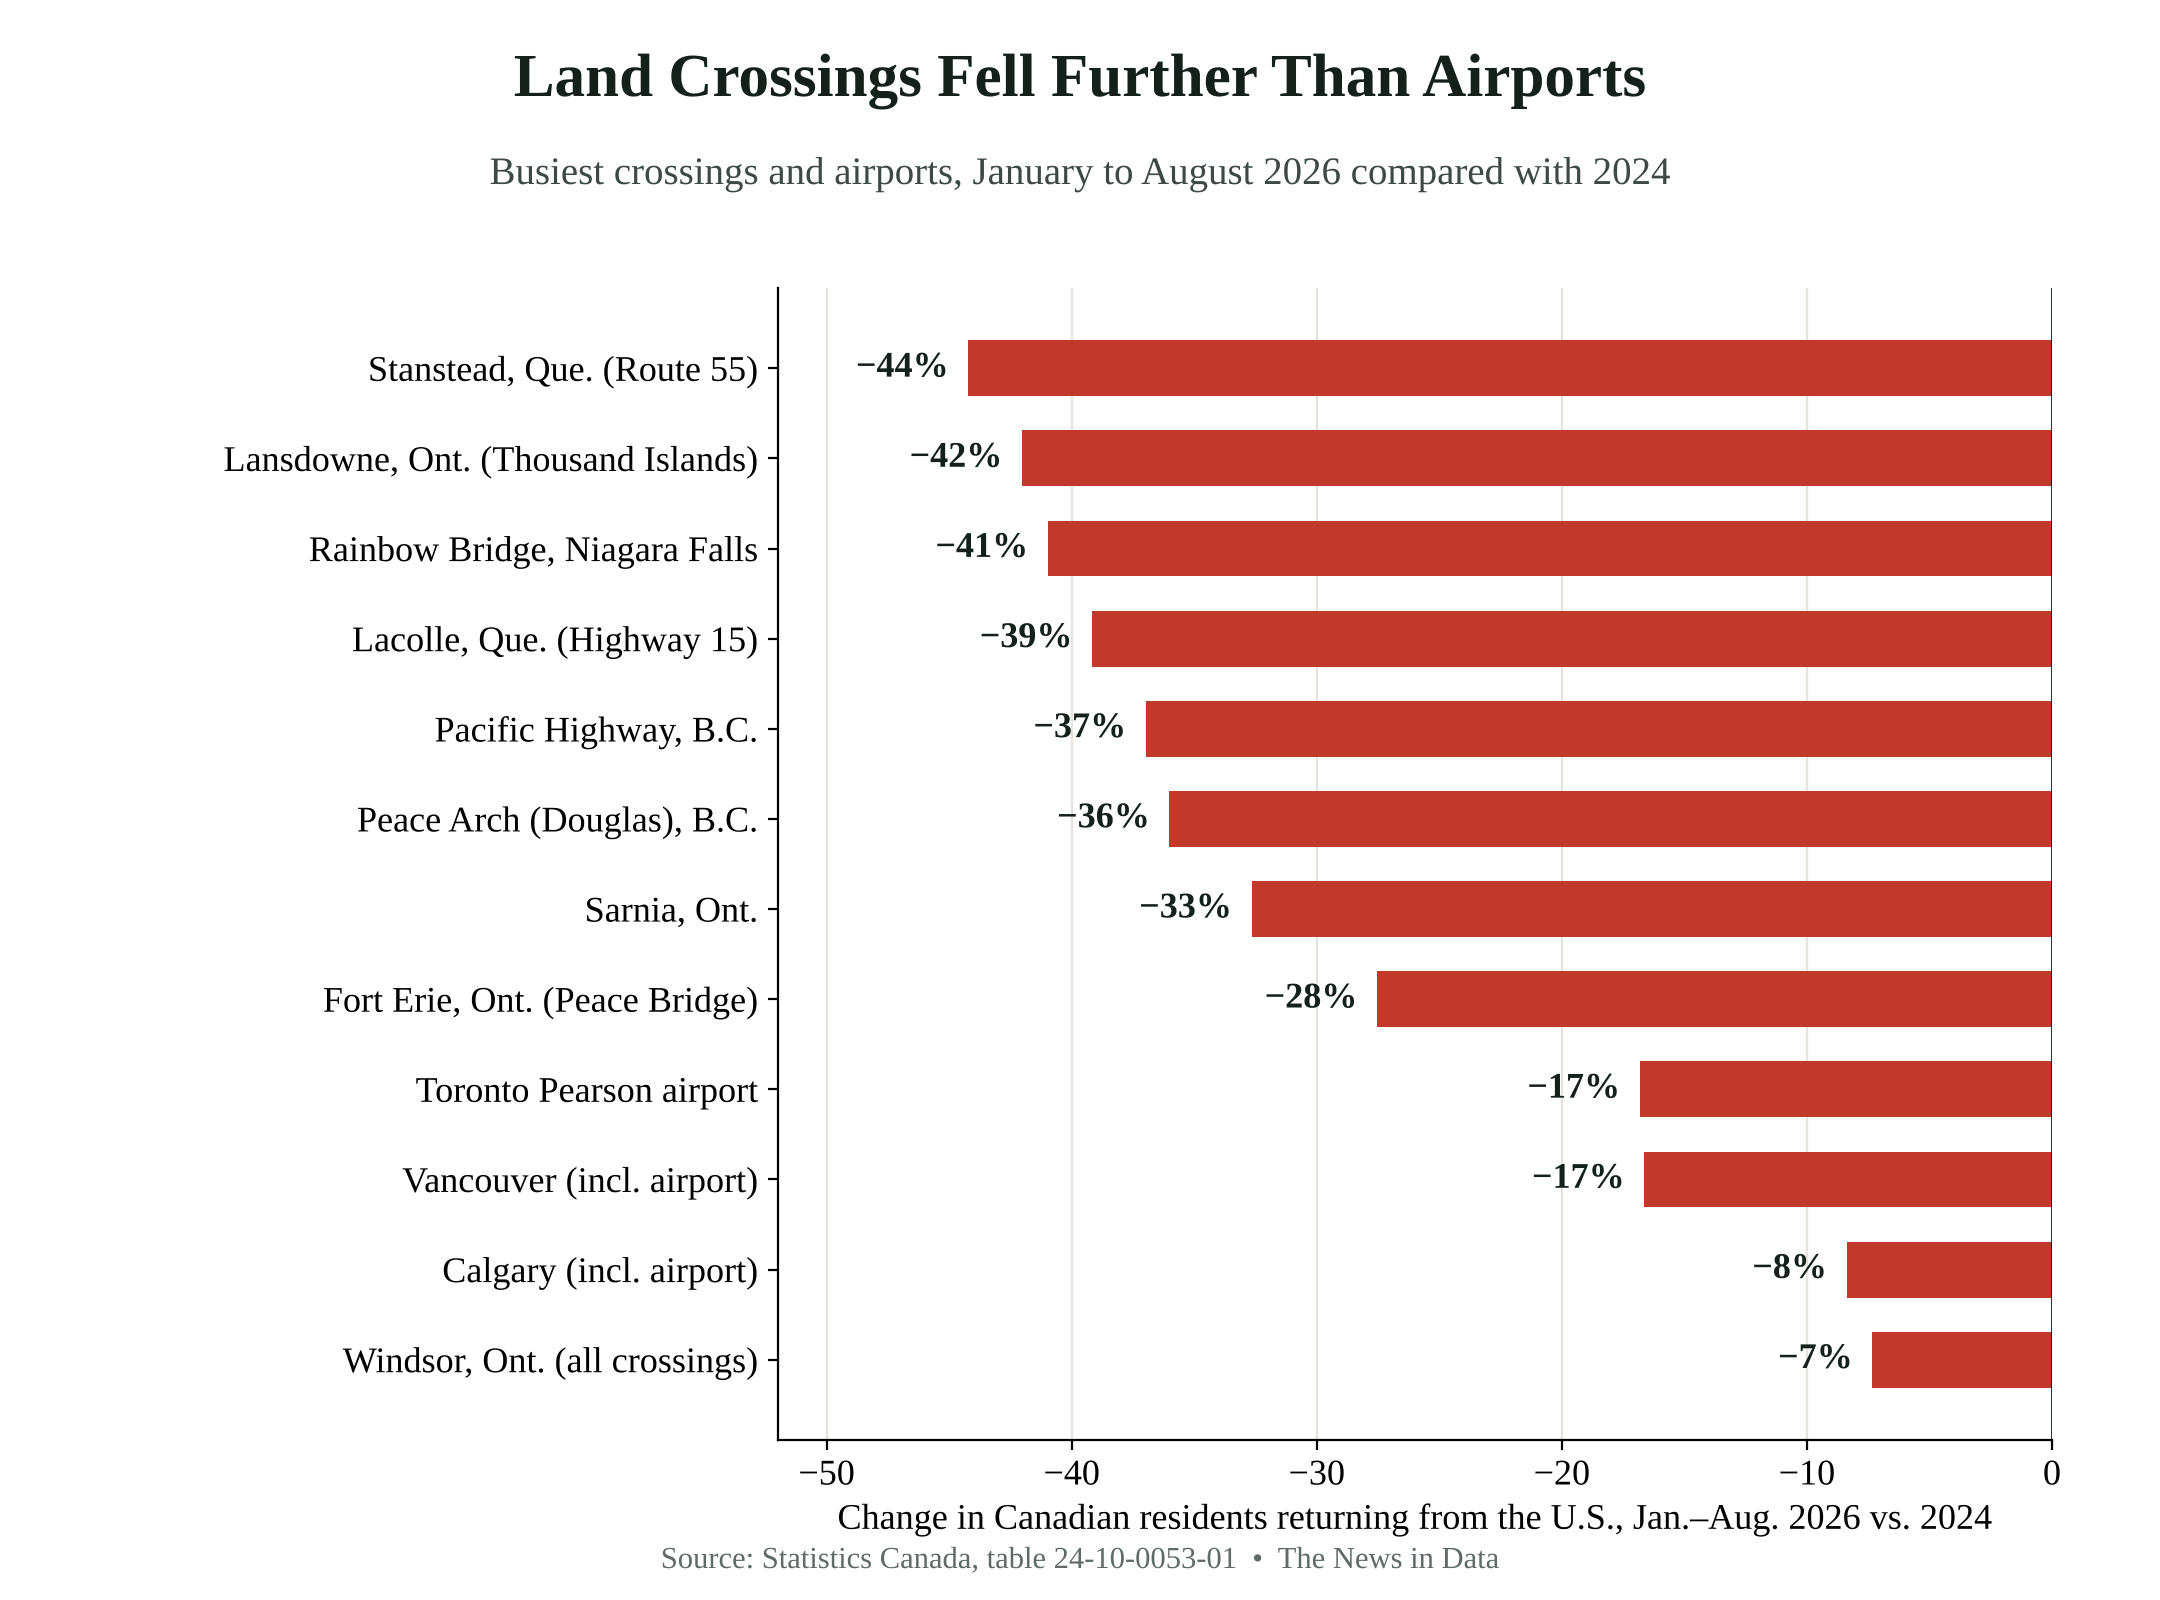
Windsor fell only 7%, the smallest drop among the busiest crossings, likely because many of the people crossing there commute to jobs in Detroit. The new Gordie Howe International Bridge, which opened in July, carried about 179,000 returning Canadians in August, about 41% of Windsor's total.


Where Canadians went instead
Canadians did not stop traveling. Return trips from countries other than the United States rose 12% from January through August compared with 2024. Travel the other way held up too: U.S. residents made 17.0 million trips into Canada, 4% more than in the same months of 2024.


How we counted: Figures are Statistics Canada's monthly counts of Canadian residents returning from the United States, by port of entry (table 24-10-0053-01), January 2024 to August 2026, the latest month available. They count trips, not people, and include same-day trips. Windsor combines all its crossings, including the Gordie Howe bridge. In the animation, each stream starts at a crossing or airport and its brightness is proportional to that month's count; the routes into the United States are illustrative. CTV News on the 2025 decline. Statistics Canada table. Download our data (CSV).