About 95 ships a day crossed the Strait of Hormuz from March through October 2025, according to IMF PortWatch, which counts ships by the tracking signals they broadcast. In the same months of 2026, after the United States and Israel struck Iran on Feb. 28, the count fell to about 6 a day, a 94% drop. Tankers fell even further, from about 54 a day to 2.
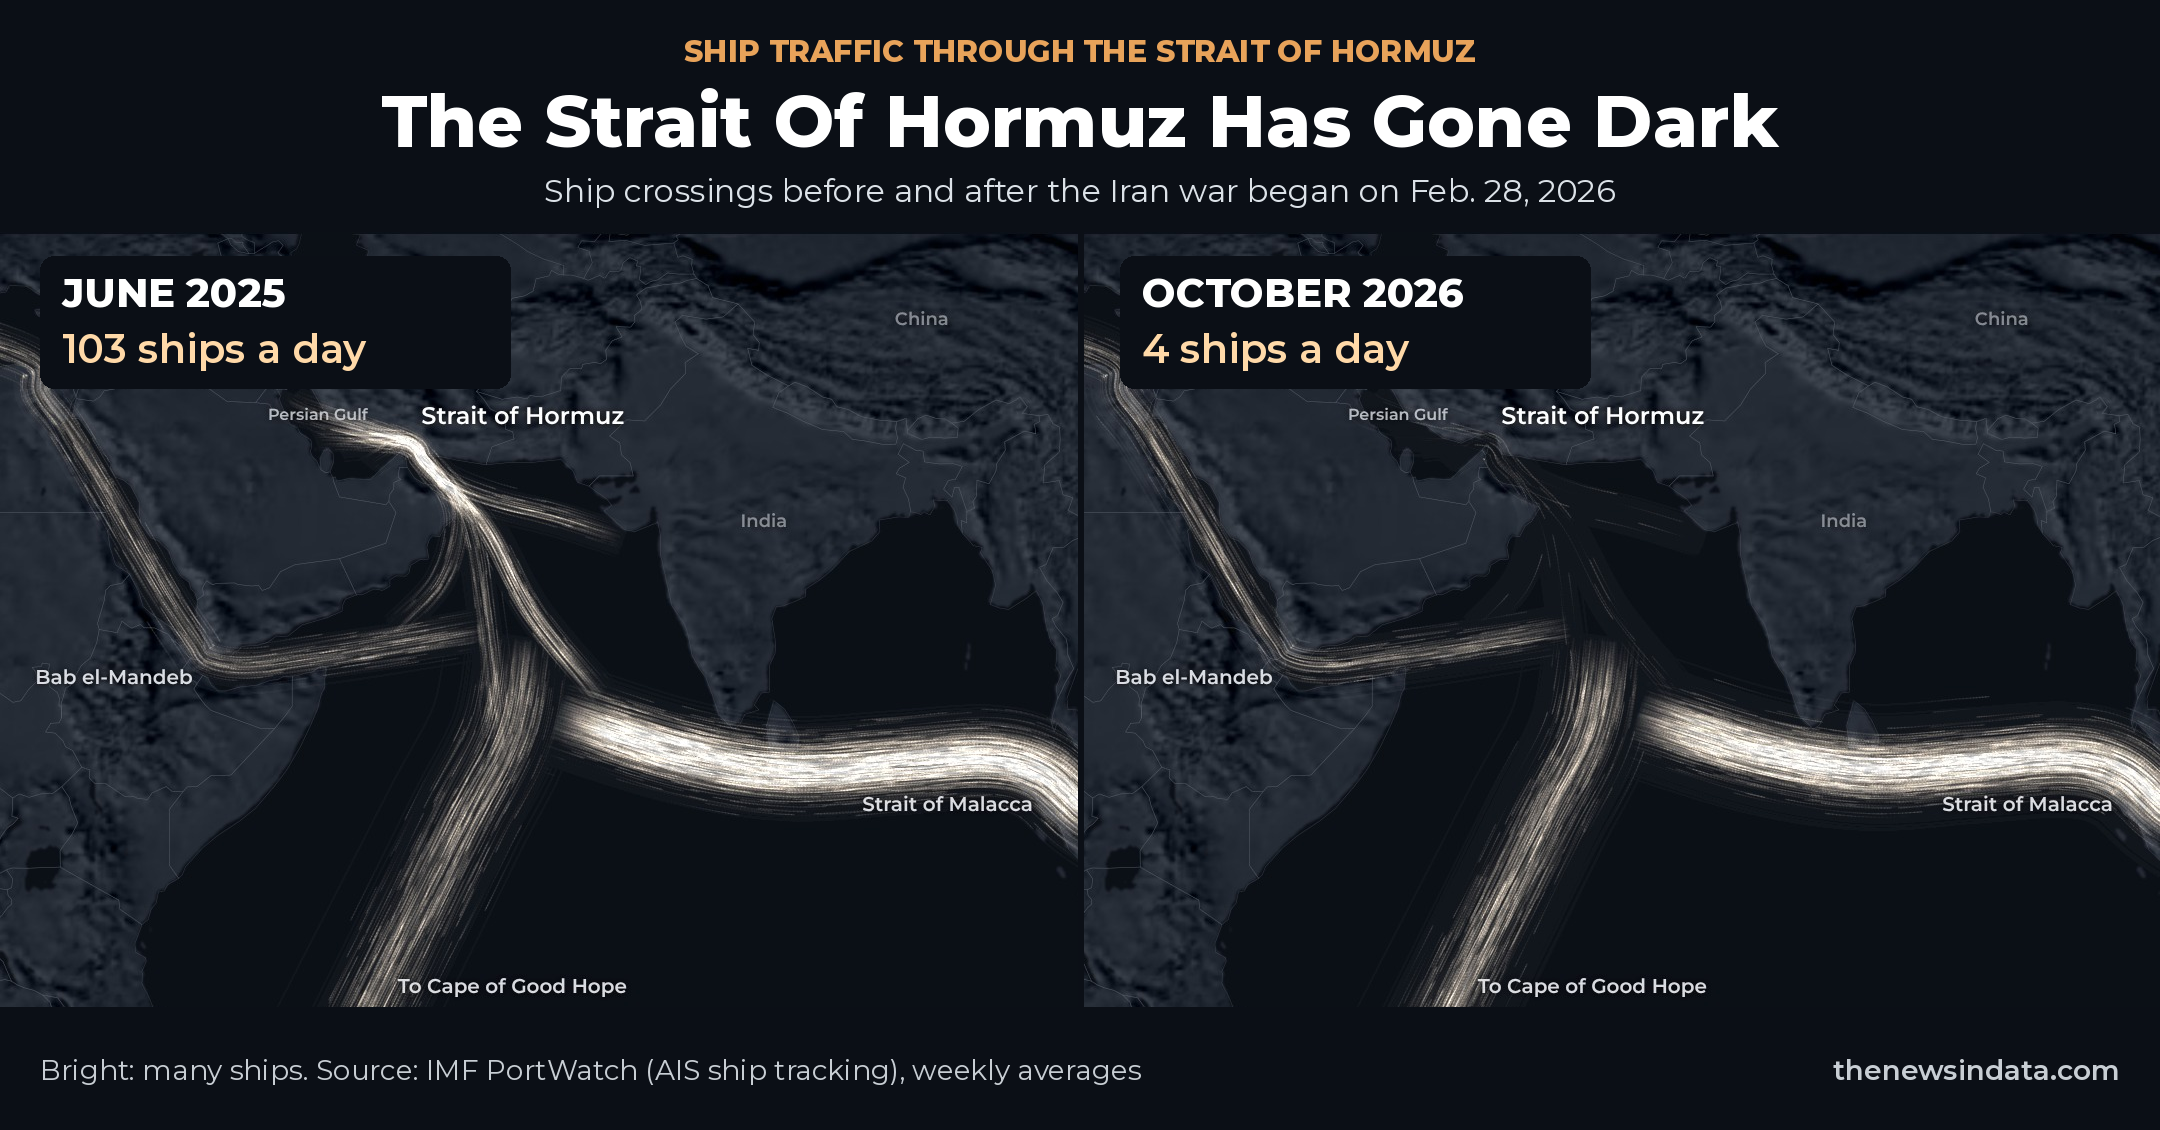
Press play below to watch a year and a half of ship traffic. Each streak is ships crossing one of the world's main shipping chokepoints, and the brighter the stream, the more ships.
What the tracking counts miss
Some ships now cross with their trackers switched off, so the PortWatch count understates traffic. S&P Global, which adds ships it infers crossed without signals, counted 750 crossings in October, about 24 a day and the most since July. Lloyd's List Intelligence counted 104 crossings in the week of Oct. 5–11 by ships not linked to Iran.
Even the highest of those counts is less than a third of the 85 ships a day PortWatch tracked through the strait over all of 2025.


A war at the world's oil chokepoint
About 20% of the world's oil passed through the strait before the war, according to the U.S. Energy Information Administration. Traffic was already softer in January and February, at about 68 ships a day, before Iran moved to close the strait within days of the strikes. In the first week of March, PortWatch tracked 18 crossings in total.
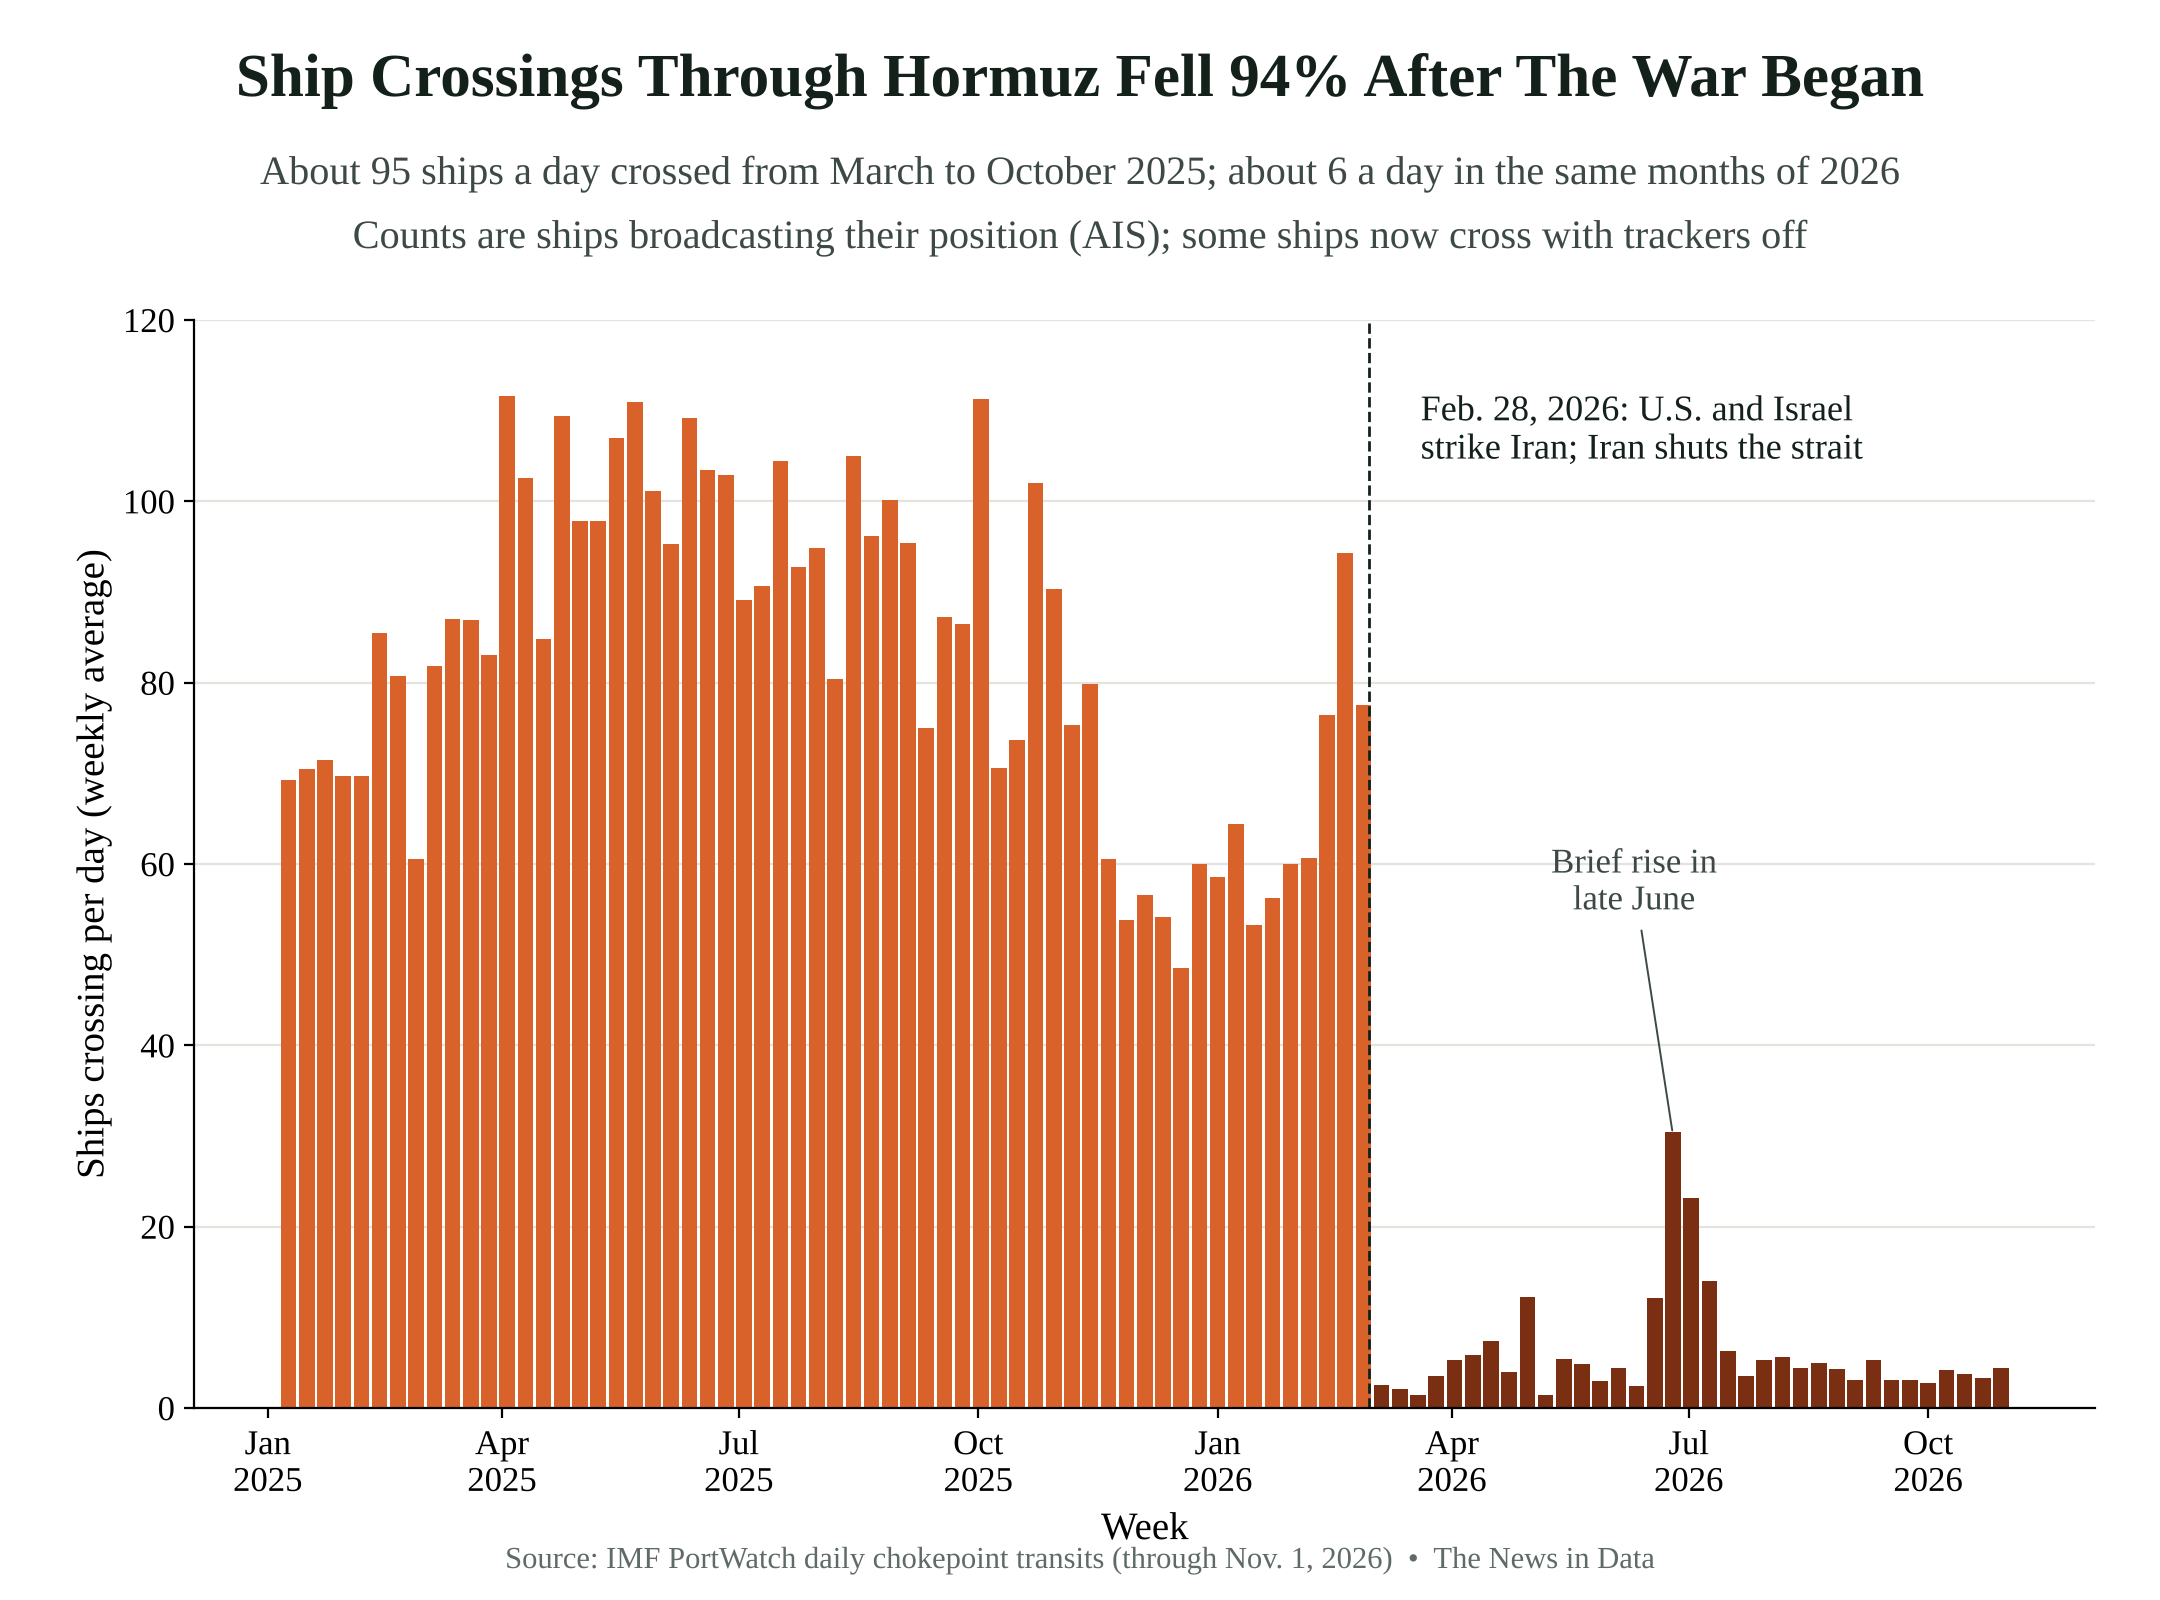
Traffic has not recovered. Crossings rose briefly in late June, to about 30 a day in the week of June 22, then fell back. The International Maritime Organization recorded 30 attacks on shipping in October and advised ships not to transit, and in September it said at least 400 merchant ships had been unable to leave the Persian Gulf safely.


The rest of the world's shipping kept moving
Traffic through the other major chokepoints barely changed. From March through October, crossings of the Suez Canal rose 7% from a year earlier, and traffic around the Cape of Good Hope was unchanged. Bab el-Mandeb, at the mouth of the Red Sea, was down 2%, though it has been depressed since Houthi attacks on shipping began in late 2023.
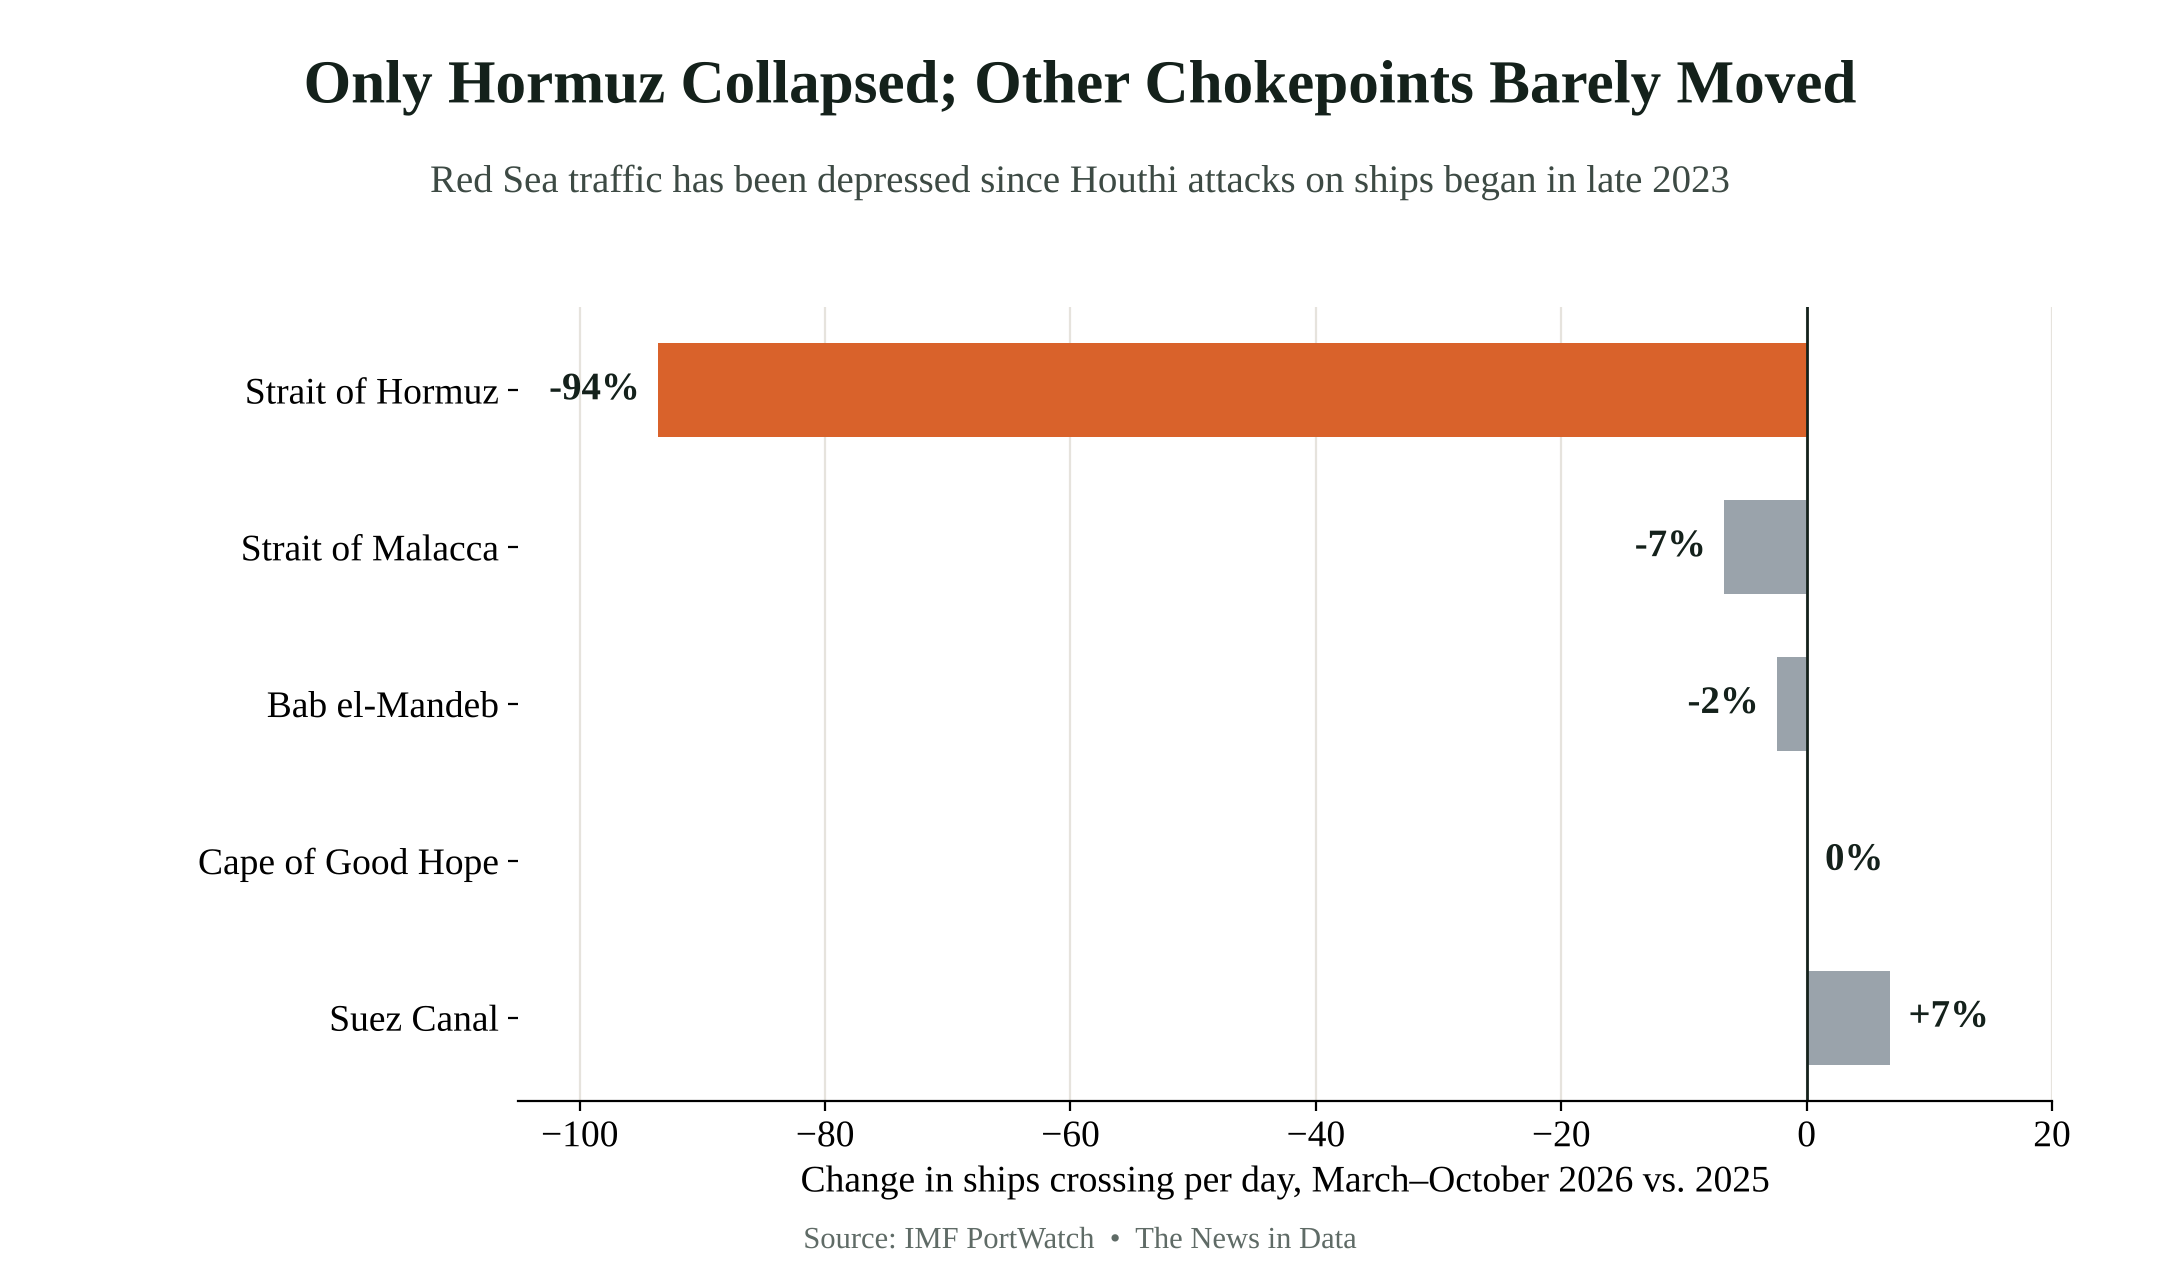
The Strait of Malacca, the main route from the Indian Ocean to East Asia, saw 7% fewer ships and 13% fewer tankers, consistent with less Gulf oil heading to China, Japan, South Korea and India. China's oil use fell 4% in the third quarter, according to a recent analysis.


How we counted: Ship crossings are daily chokepoint transit counts from IMF PortWatch, which detects ships from their Automatic Identification System (AIS) signals, through Nov. 1, 2026, summed by week. Percent changes compare March through October 2026 with the same weeks of 2025. Ships crossing with AIS switched off are missed, so we also cite S&P Global and Lloyd's List Intelligence, which use different methods. In the animation, routes are simplified, and the number of streaks on each lane is proportional to that chokepoint's weekly count. IMF PortWatch. S&P Global, Nov. 2. Lloyd's List Intelligence, Oct. 22. gCaptain on the Feb. 28 strikes. Download our data (CSV).