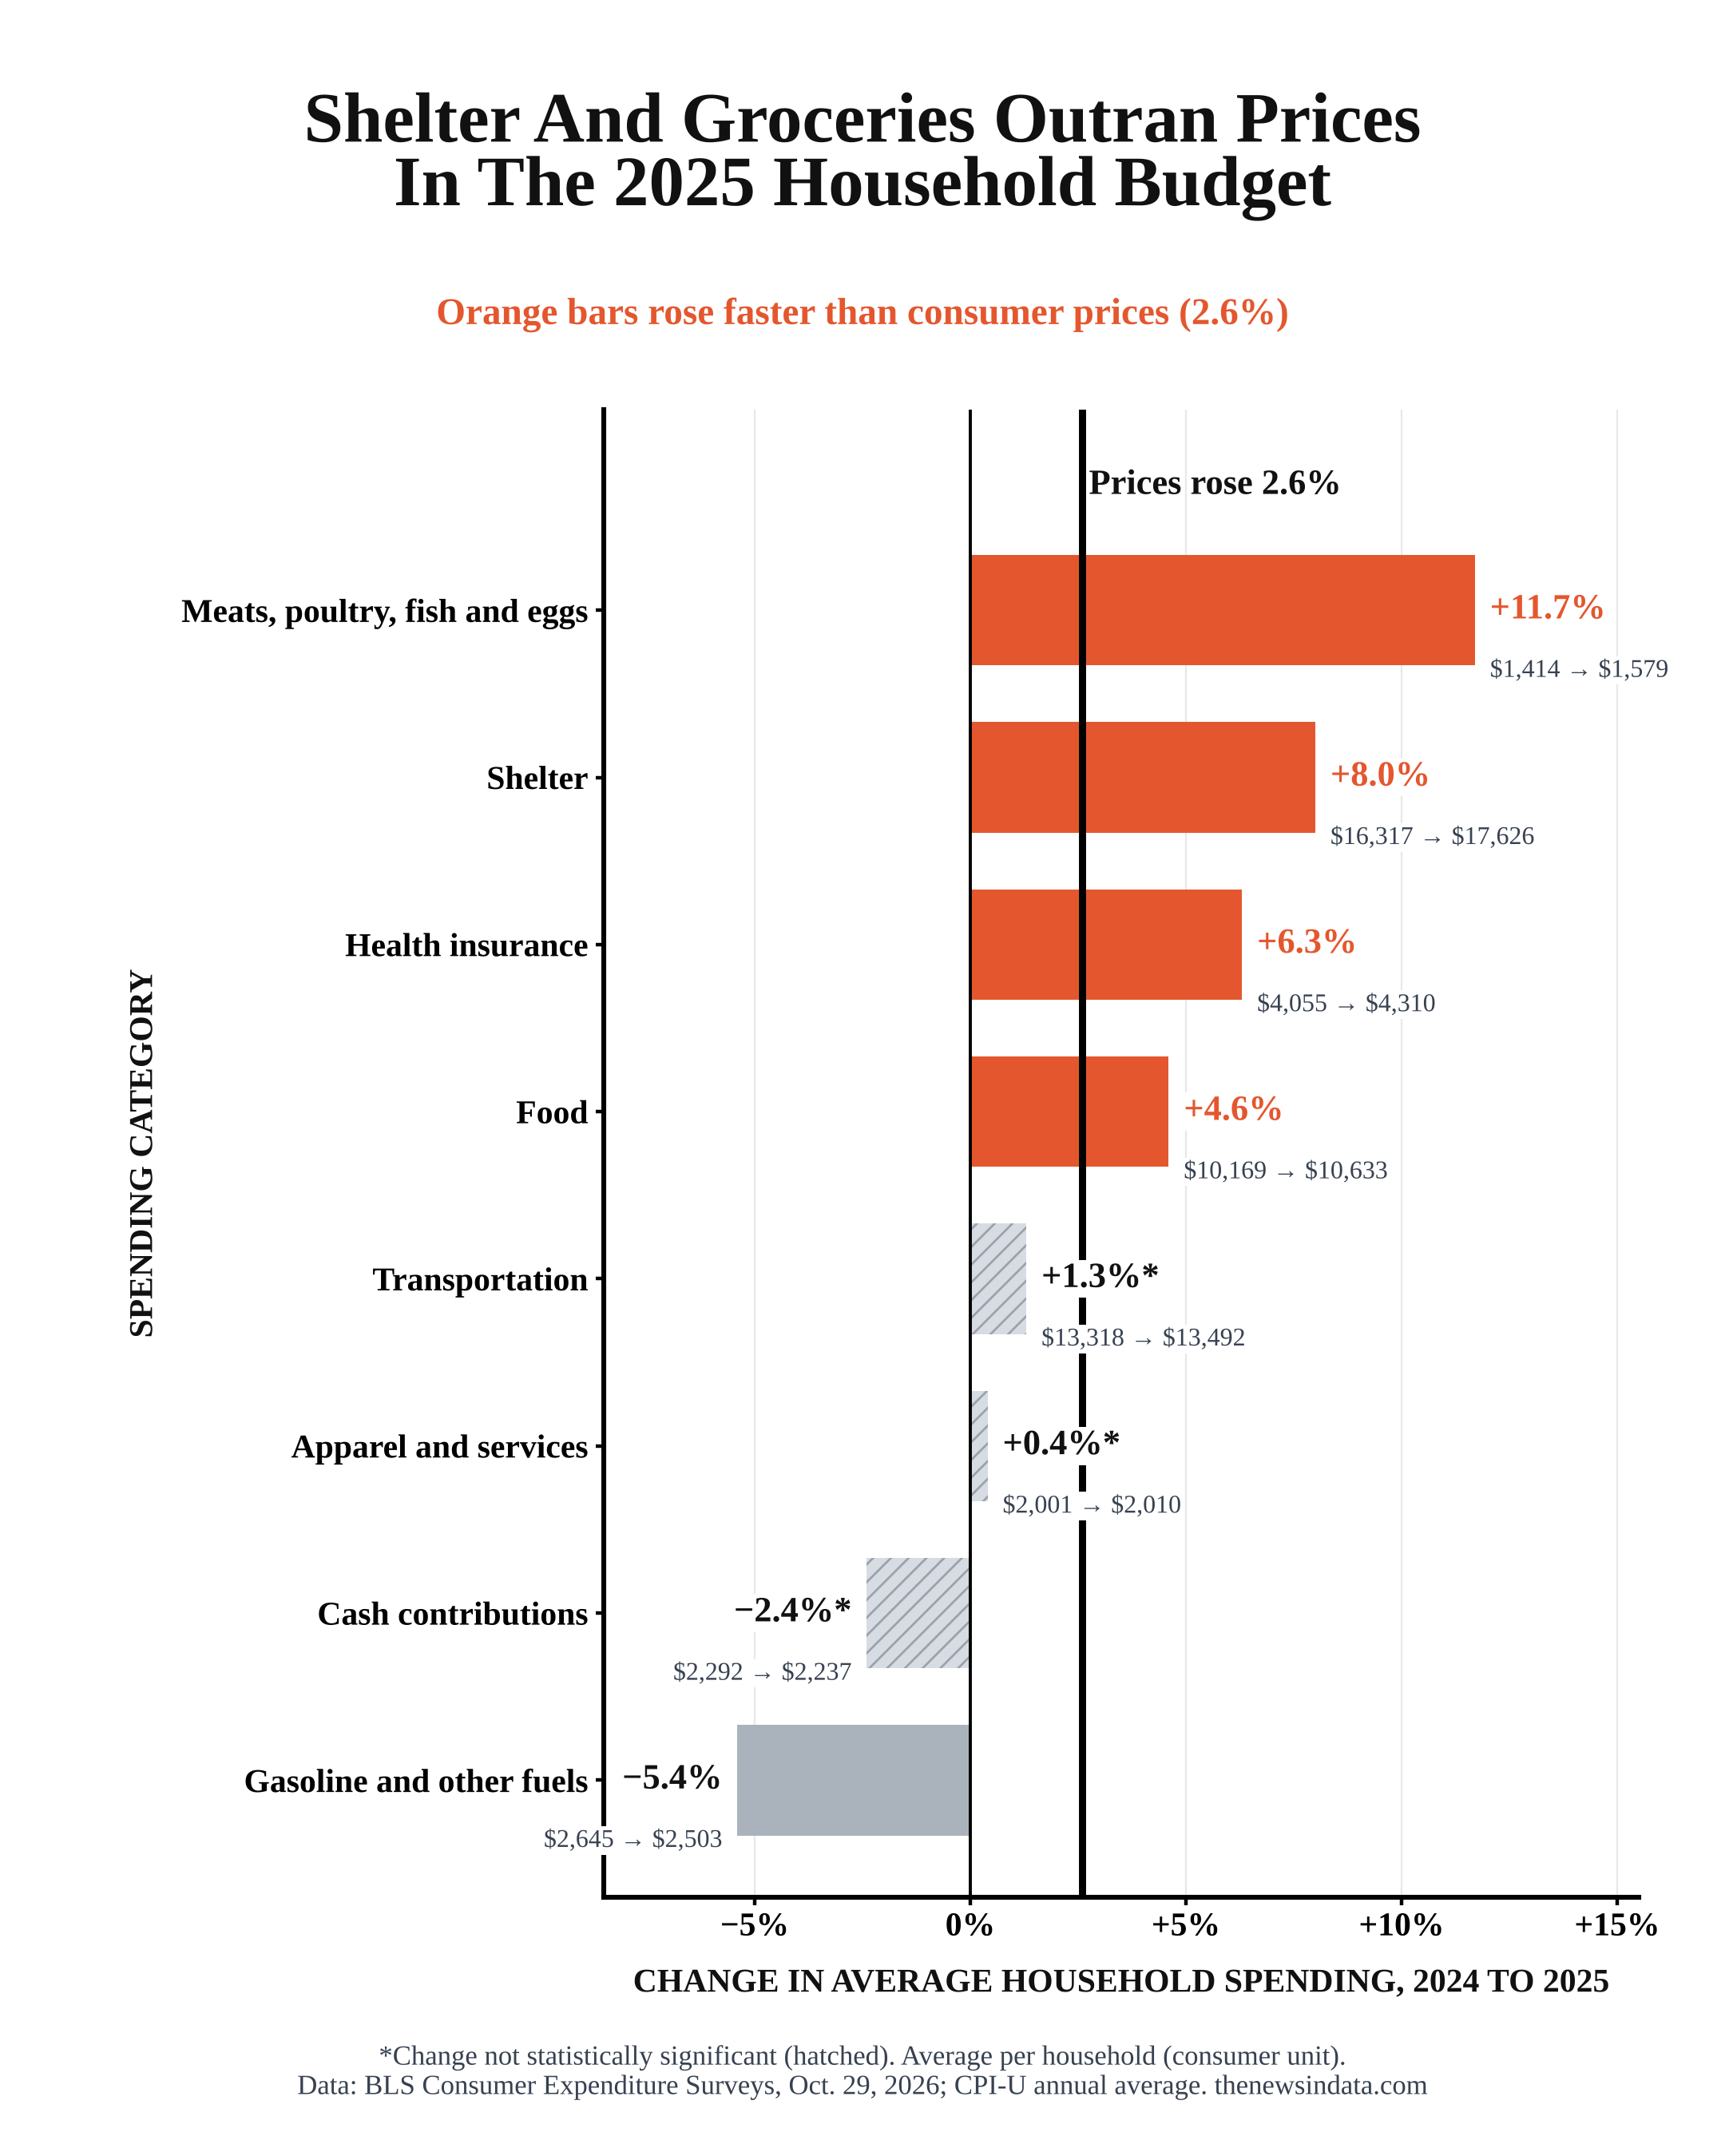
Average household spending on shelter rose 8.0% in 2025, to $17,626, while consumer prices rose 2.6%, according to Consumer Expenditure Surveys data the Bureau of Labor Statistics released Oct. 29. Spending on meats, poultry, fish and eggs rose 11.7% and health insurance rose 6.3%, and spending on gasoline fell 5.4%.
Spending rose faster than prices, and income rose faster still
Average annual spending per household was $81,905 in 2025, up 4.3% from $78,527 in 2024. Average income before taxes rose 6.4%, to $110,847. Both grew faster than the 2.6% rise in the Consumer Price Index for All Urban Consumers over the same period, so the average household spent and earned more in real terms, though the averages say nothing about how any single household fared.
Housing takes a third of the budget


Housing, which includes shelter, utilities, furnishings and household operations, totaled $27,790, or 33.9% of spending, up 5.8% from 2024. Shelter alone, mostly rent, mortgage interest, property taxes and maintenance, rose by $1,309 per household, the largest dollar increase of any category in the release.
Groceries and gas moved in opposite directions


Total food spending rose 4.6%, to $10,633. Within it, meats, poultry, fish and eggs rose from $1,414 to $1,579, the largest percentage increase among the changes BLS marks as statistically significant. Gasoline and other fuels fell from $2,645 to $2,503, one of the few categories with a significant decline.


What the data can't tell us
BLS tests changes in dollar amounts for statistical significance, and several large-looking changes did not pass: entertainment rose 13.2% and food away from home 5.0%, and neither was significant, nor were the changes in transportation, apparel or cash contributions. "Other vehicle expenses" rose 13.3% partly because BLS changed the survey that supplies one of its parts. The Census Bureau could not collect the surveys in October and November 2025 during the lapse in federal funding, and BLS adjusted the weights to make up for the missing months. Because October 2025 CPI data were never collected, the 2025 CPI average used for comparison is based on 11 months.
How we counted: spending, income and significance flags are from the BLS "Consumer Expenditures — 2025" release (USDL-26-1619), Oct. 29, 2026, Table 1, averages per consumer unit (roughly a household). Changes are not adjusted for inflation; the 2.6% price comparison is the change in the CPI-U annual average cited in the release. Bars marked with an asterisk were not statistically significant at the 95% level. Sources: BLS release, Oct. 29, 2026; Consumer Expenditure Surveys tables.