Private-industry wages and salaries rose 3.1% in the 12 months ending in September, according to the Employment Cost Index released Oct. 30 by the Bureau of Labor Statistics. Adjusted for inflation, they fell 0.6%, the second straight quarter in which pay trailed prices by our calculation from BLS data.
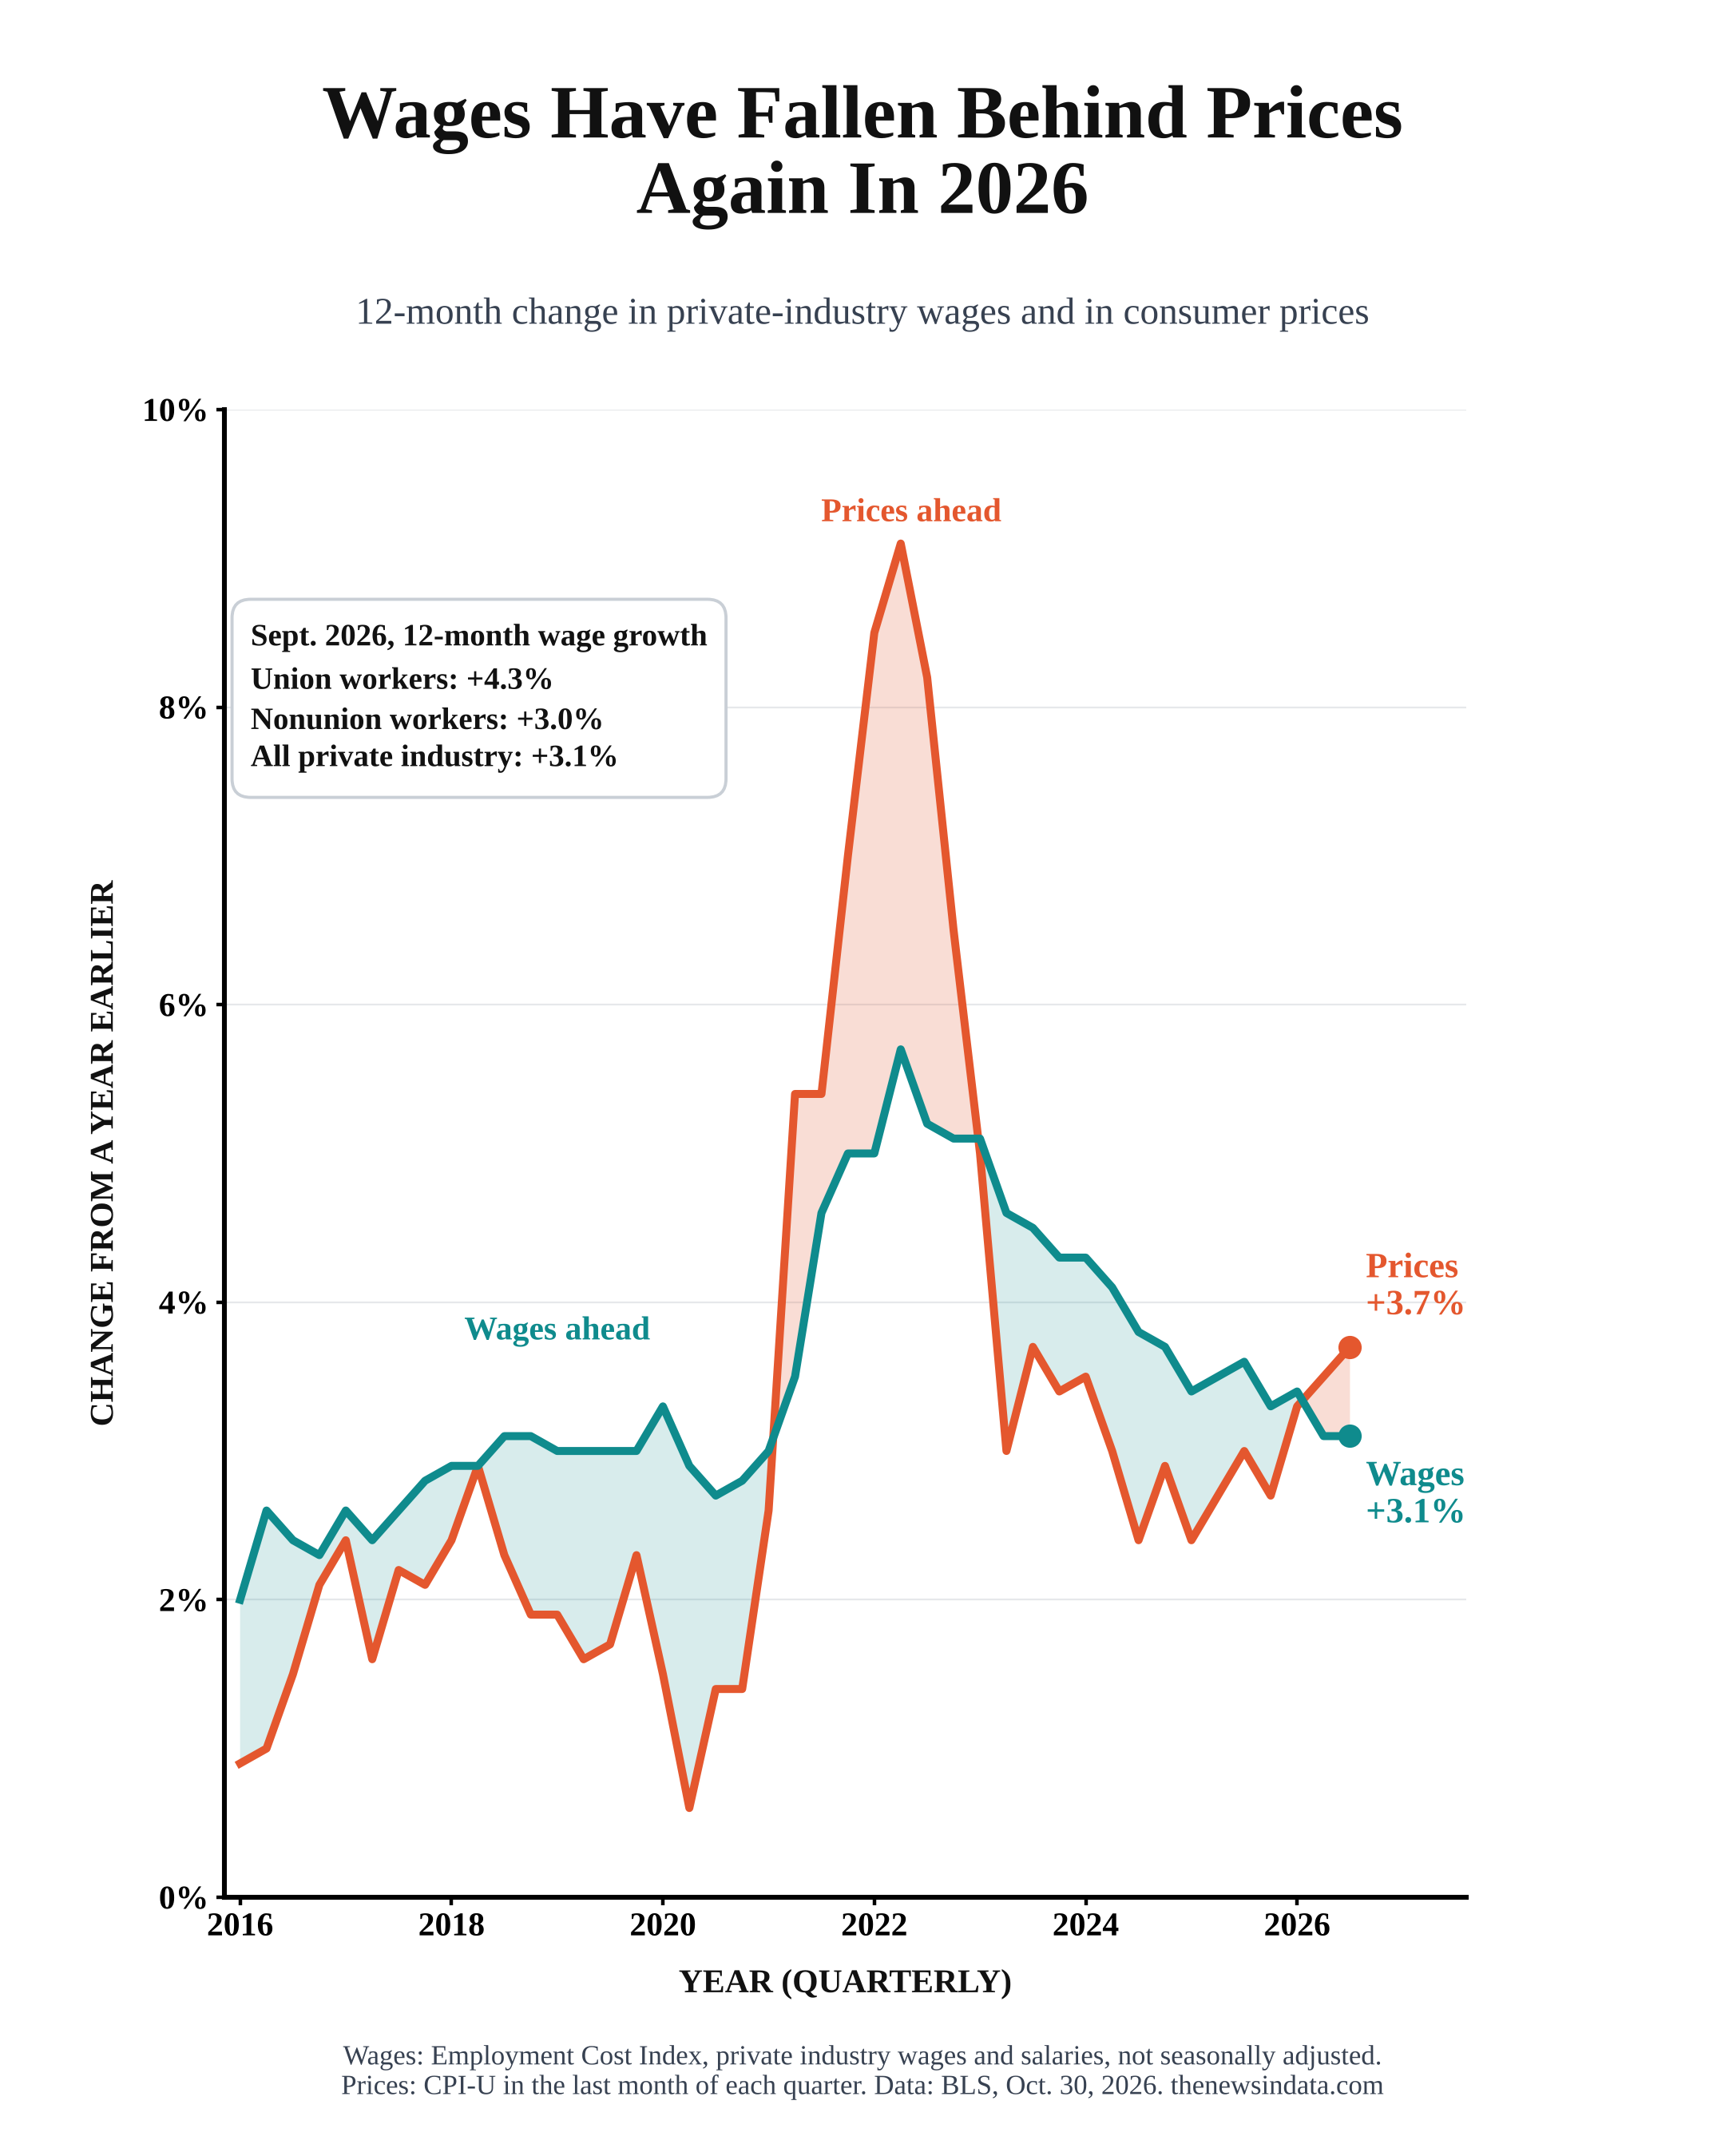
Prices rose 3.7% over the same 12 months
The Consumer Price Index for All Urban Consumers rose 3.7% from September 2025 to September 2026. By our measure, prices have outpaced wages in each of the last two quarters, the first time since late 2022. From early 2023 through early 2026, 12-month wage growth stayed ahead of price growth in every quarter, after nearly two years in which inflation outran pay. The 3.1% wage gain matches the June figure as the slowest since early 2021.
Union workers kept ahead


Wages and salaries rose 4.3% for union workers and 3.0% for nonunion workers over the year, so union pay grew faster than prices and nonunion pay did not. State and local government wages rose 3.2%, and fell 0.5% after inflation. Total compensation for civilian workers, which adds benefits such as health insurance and retirement contributions, rose 3.4%, with private-industry benefit costs up 3.9%.
What the data can't tell us


The Employment Cost Index measures the cost of a fixed set of jobs, so it does not reflect workers changing jobs, hours or occupations, and it is not the same as the change in any one worker's paycheck. It also does not show which industries or regions fell furthest behind. BLS will introduce updated employment weights starting with the December 2026 data.
How we counted: wage changes are from the BLS Employment Cost Index for the third quarter of 2026, released Oct. 30, 2026, not seasonally adjusted. The chart compares the 12-month change in the ECI for private-industry wages and salaries with the 12-month change in the CPI-U (not seasonally adjusted) in the last month of each quarter, both calculated by us from BLS index levels; our September figures match the 3.1% and −0.6% BLS published. Sources: BLS Employment Cost Index, Oct. 30, 2026; BLS ECI series CIU2020000000000I; BLS CPI-U series CUUR0000SA0.