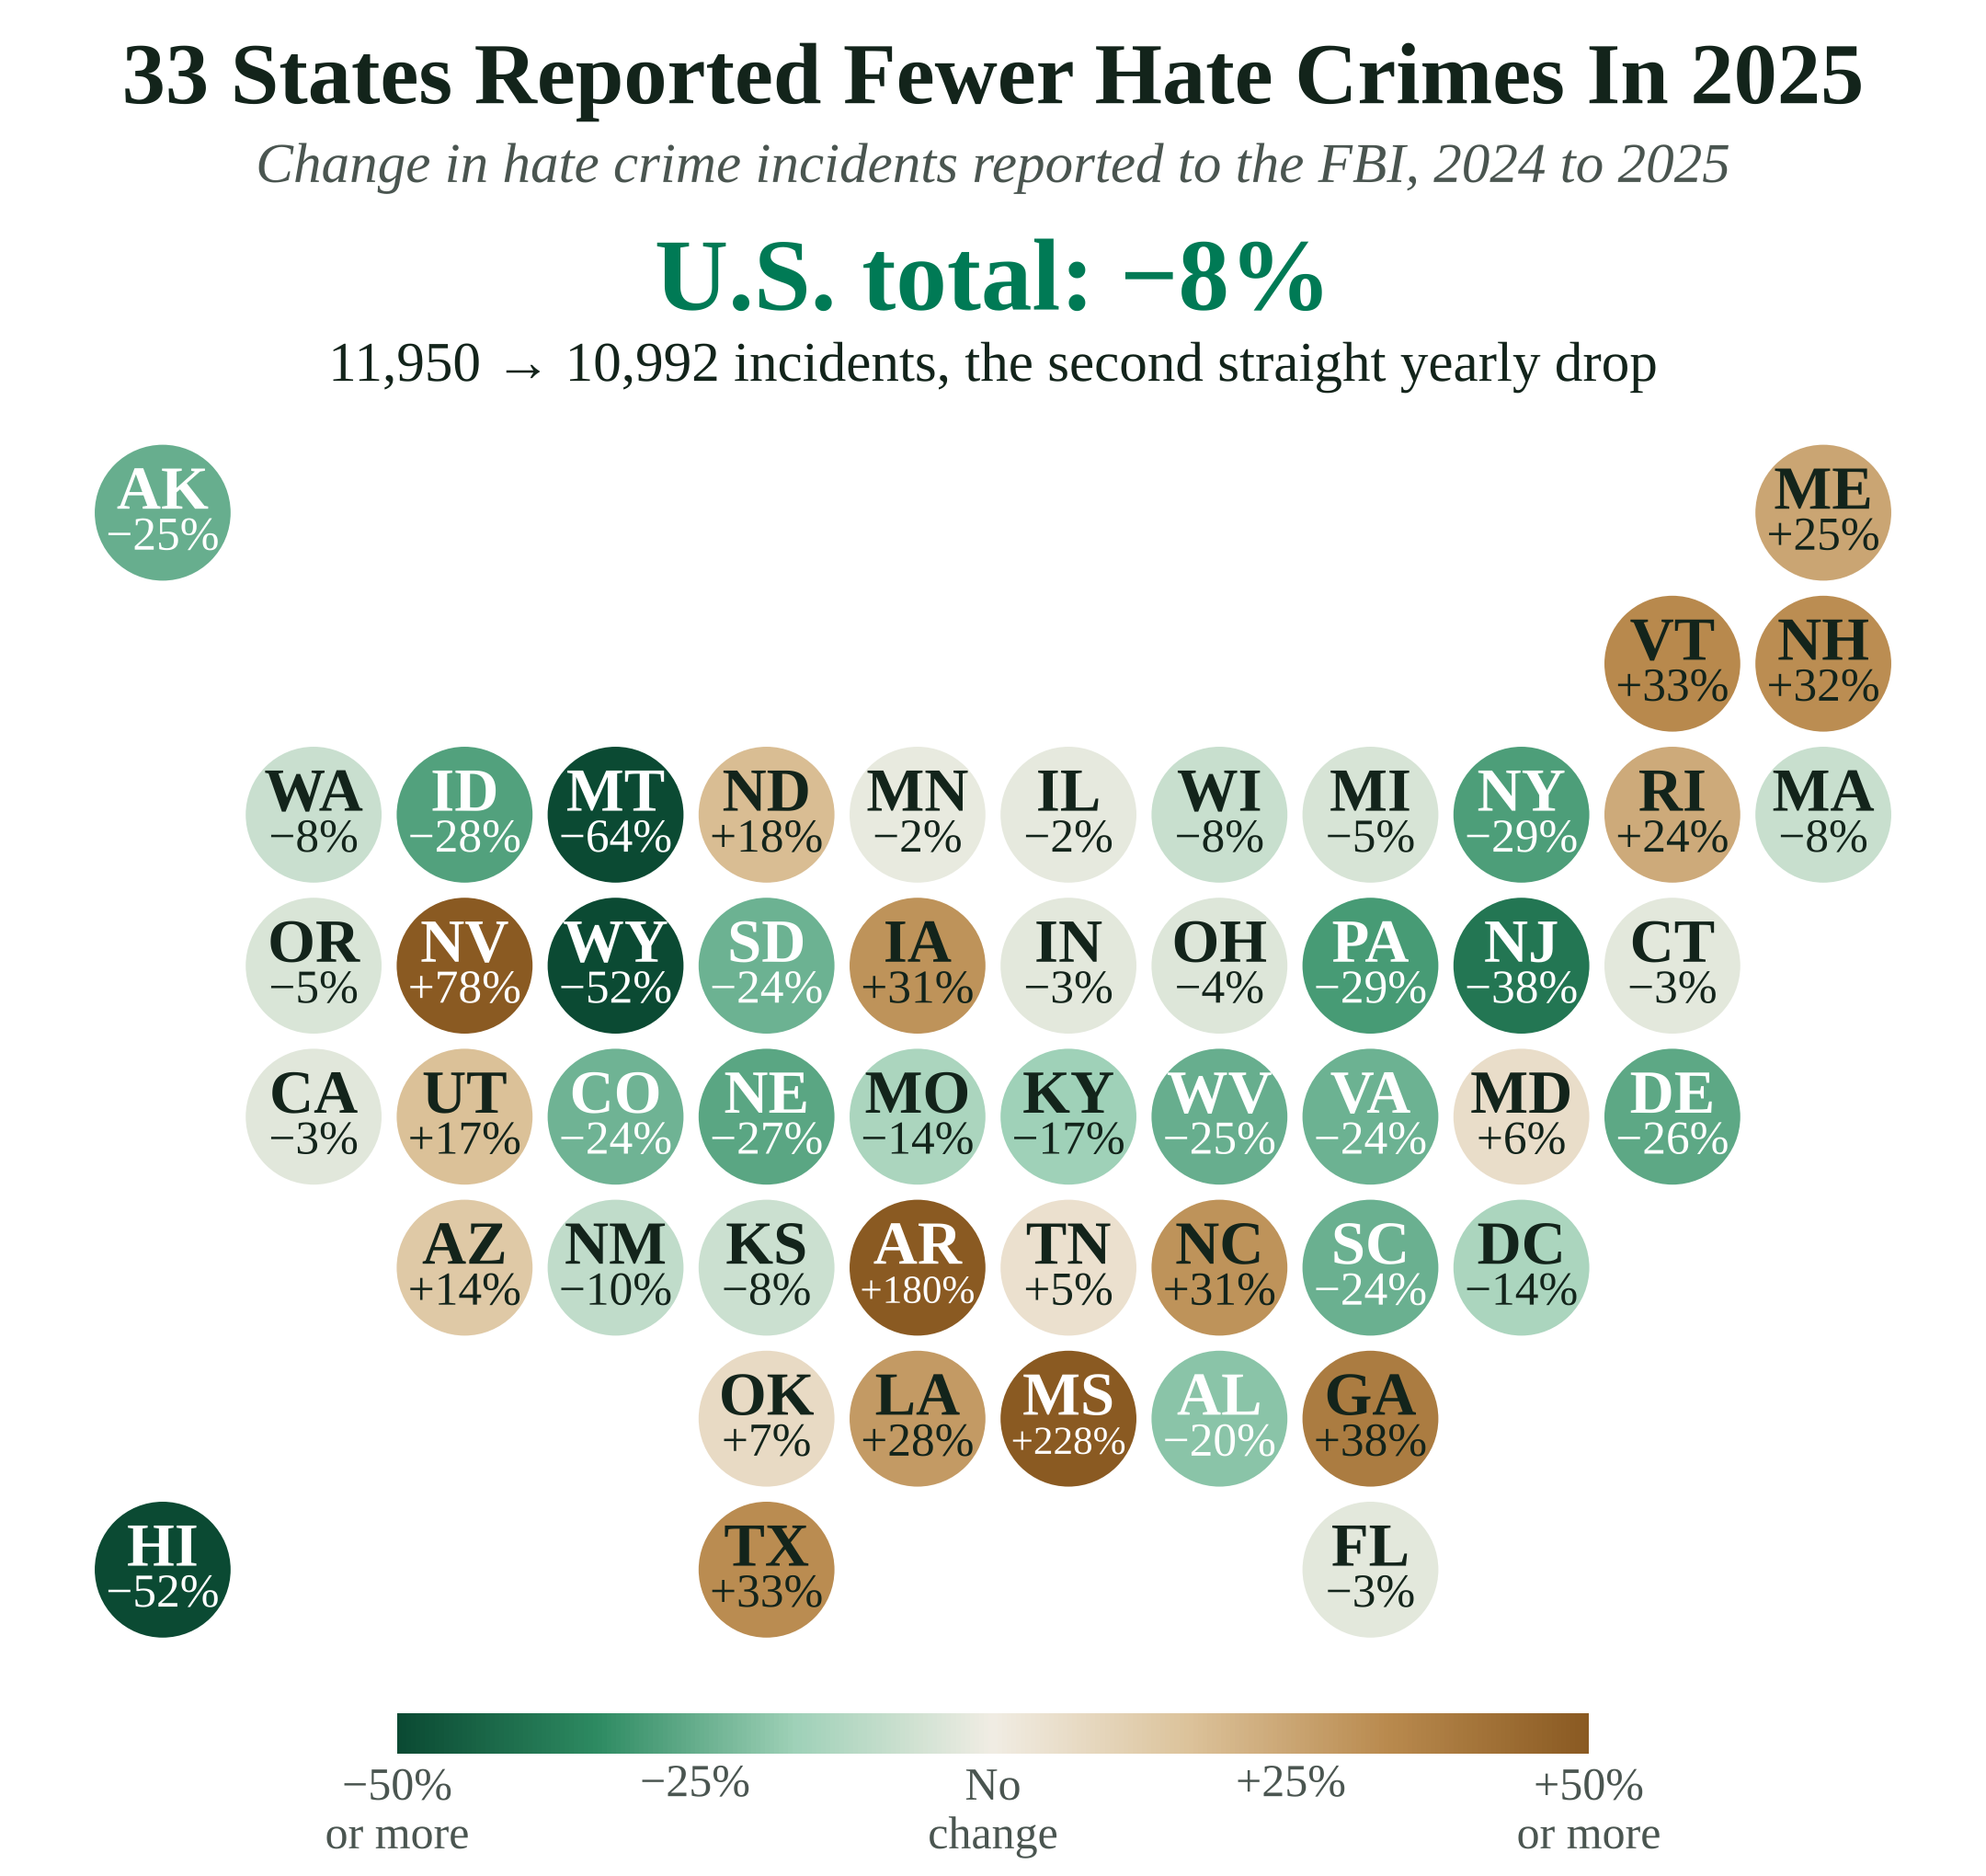
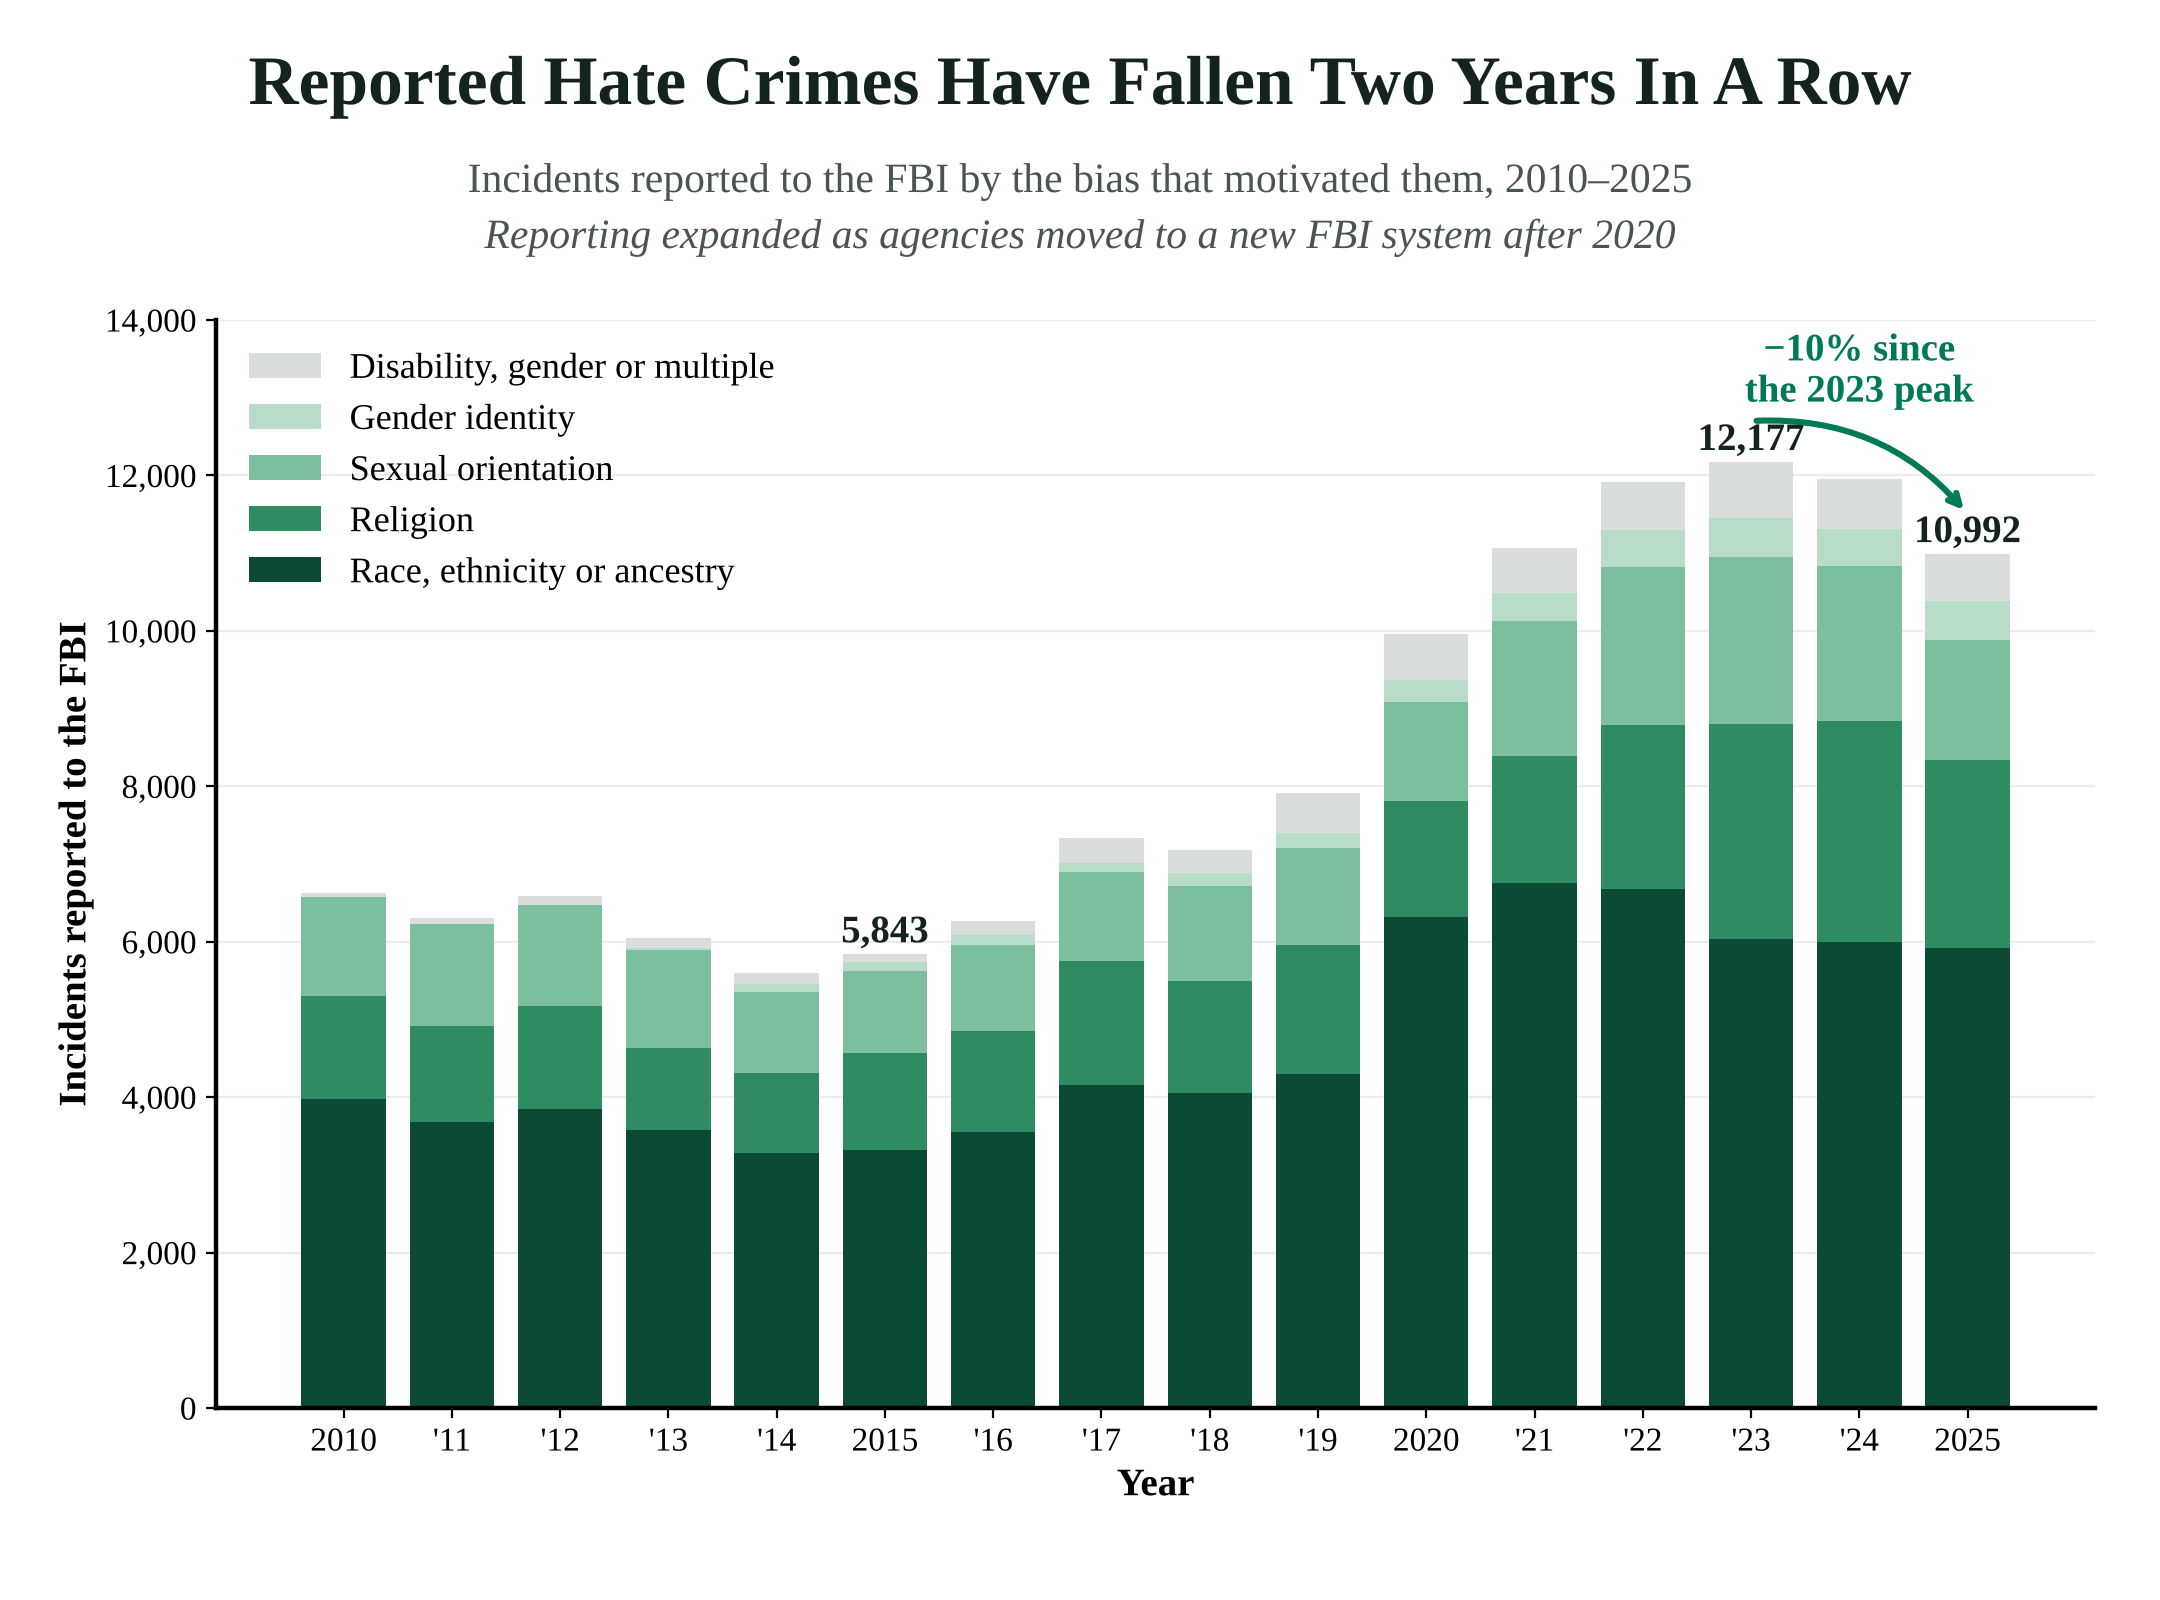
In December 2016 I published the second edition of "The State of Hate," ranking states, cities and college campuses by the hate crimes their police reported to the FBI. Ten years later I ran the numbers again, and the newest figures carry some good news. Police agencies reported 10,992 hate crime incidents in 2025, according to the FBI's Crime Data Explorer, 8% fewer than the 11,950 reported in 2024 and the second drop in a row.
That makes it the first back-to-back decline since 2013 and 2014, and the 2025 total is 10% below the 2023 peak of 12,177. Thirty-three states reported fewer incidents than the year before, while 18 states reported more.
The long view is less rosy
The 2025 total is still nearly double the 5,843 incidents reported in 2015, the year my 2016 post covered. Part of that rise reflects more and better reporting rather than more hate. After 2020 the FBI moved every agency to a new, more detailed reporting system, and states whose police once reported almost nothing now report hundreds of incidents. Alabama went from 10 reported incidents in 2015 to 147 in 2025, Maryland from 41 to 277 and Illinois from 90 to 376.
Even the bigger numbers are a small slice of the total. The Bureau of Justice Statistics' victim survey estimated about 246,900 hate crime victimizations a year from 2005 to 2019, more than 20 times the number police reported in any of those years, because many victims never call the police.


Who was targeted
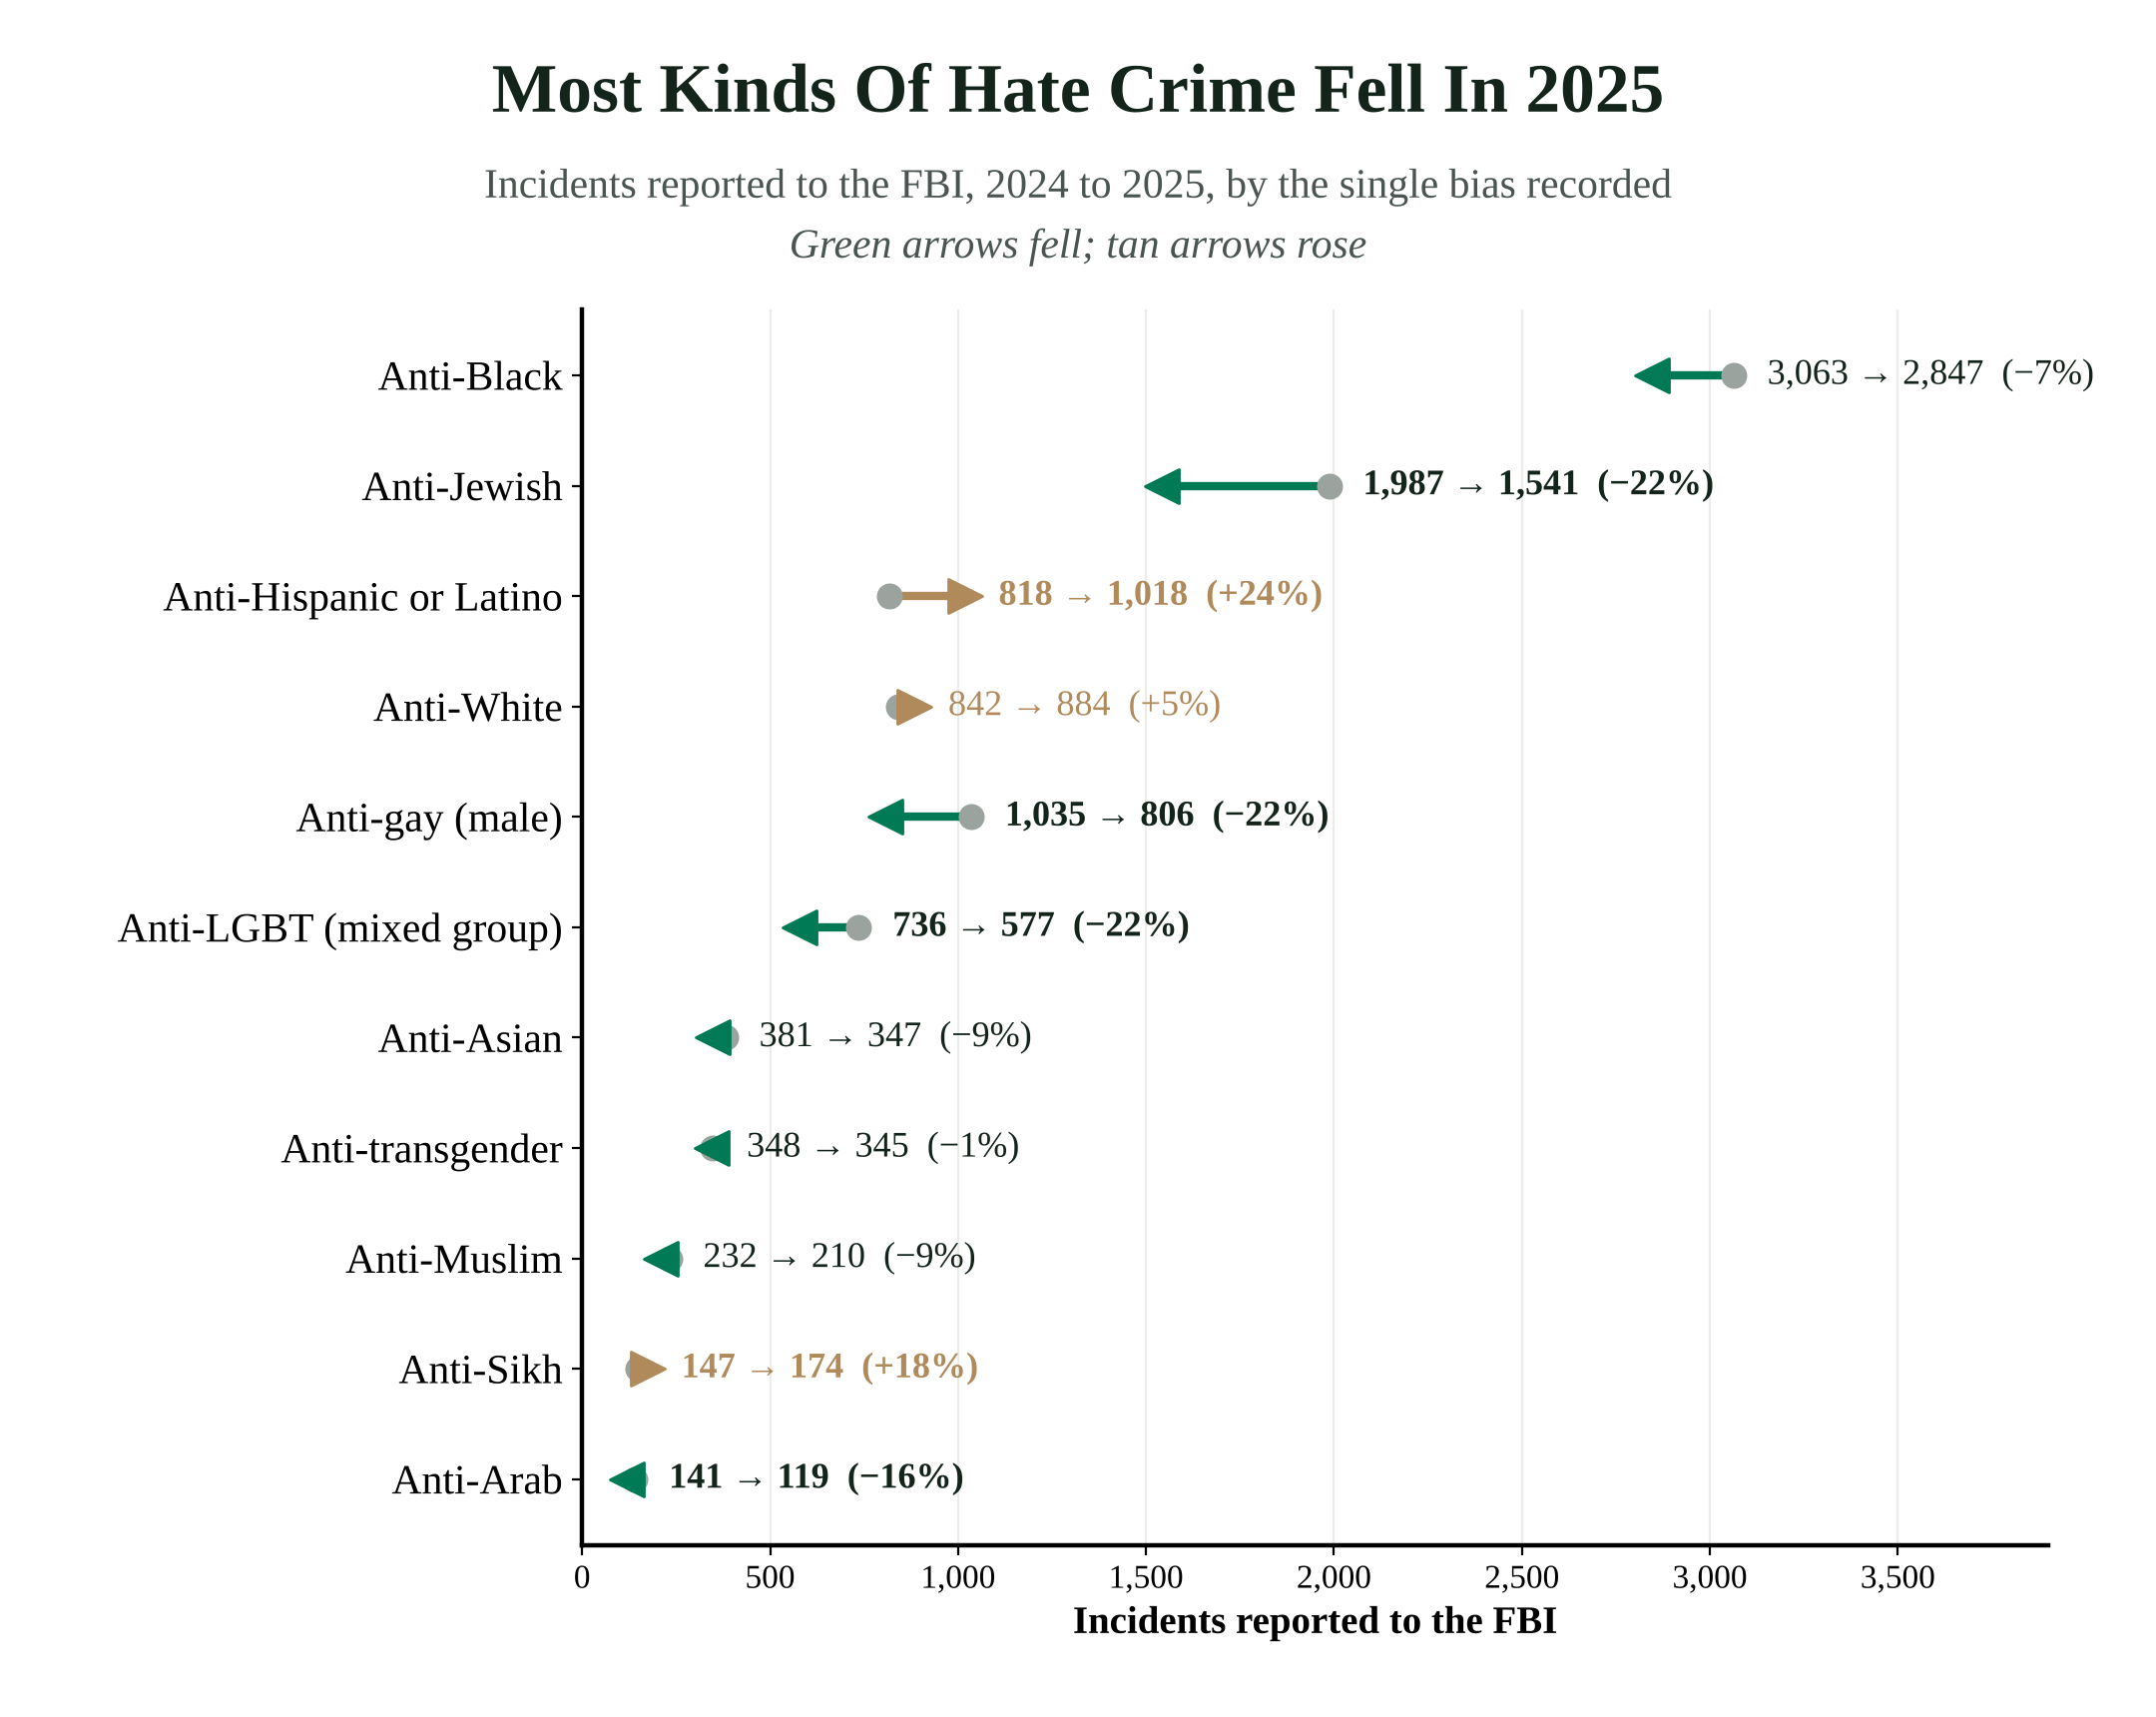
Most kinds of hate crime fell in 2025. Anti-Jewish incidents dropped 22%, from 1,987 to 1,541, and incidents targeting gay men and the LGBT community as a group each fell 22% as well. Anti-Black incidents, still the largest category at 2,847, fell 7% to their lowest level since 2019.
Three groups saw increases. Anti-Hispanic incidents rose 24%, from 818 to 1,018, the most in any year since at least 2015, and anti-Sikh incidents rose 18%, from 147 to 174. Anti-white incidents rose 5%, to 884.
State by state
New Jersey had the largest drop, from 1,221 incidents to 752, a 38% decline, followed by New York, which fell from 915 to 654. Virginia and Pennsylvania each reported about 80 fewer incidents. On the other side, Texas rose from 471 to 625 and Nevada from 139 to 248.
Per person, the District of Columbia again had the highest rate, 20.9 incidents per 100,000 residents, followed by New Jersey at 8.1 and Oregon and Nevada at 7.6. The U.S. rate was 3.3. North Dakota, which topped my 2016 ranking, now ranks 18th at 3.3. Montana reported four incidents all year, the lowest rate in the country at 0.3, and Florida's 1.0 comes from agencies covering only 85% of its residents.
Big cities
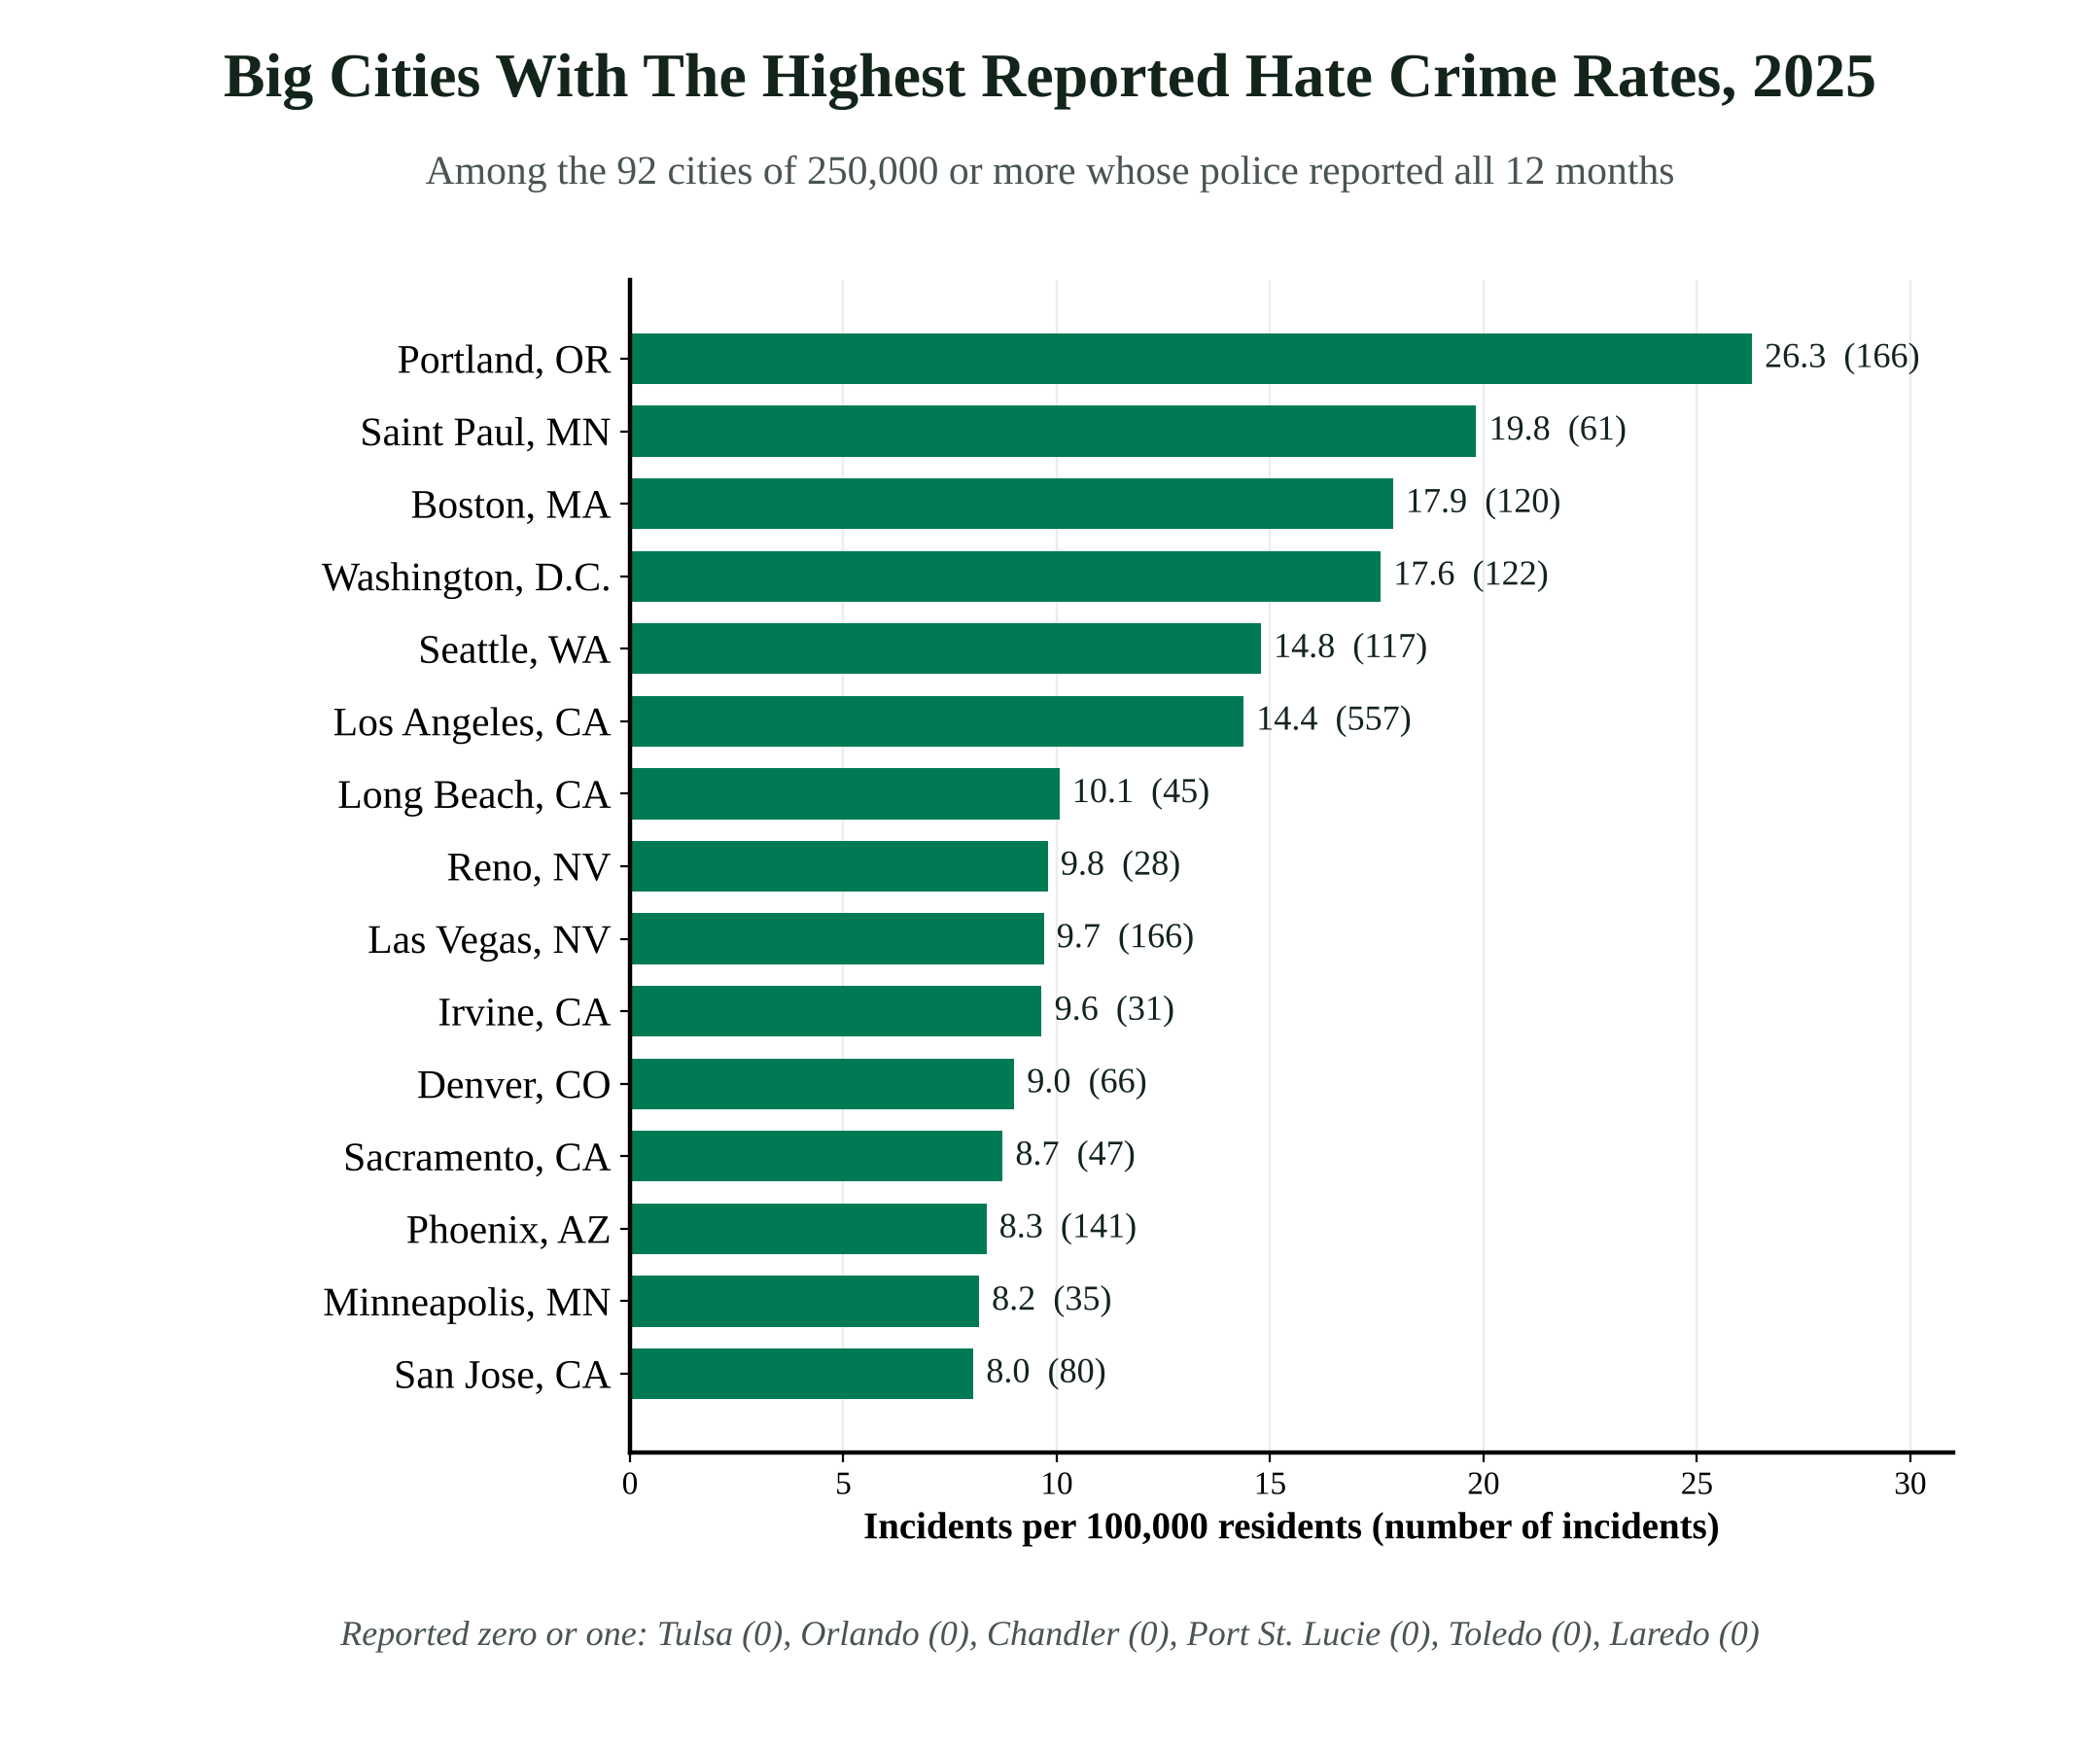
Among the 92 cities of 250,000 or more whose police reported all 12 months of 2025, 46 reported fewer hate crimes than in 2024 and 39 reported more. Portland, Ore., had the highest rate, 26.3 per 100,000, followed by Saint Paul, Minn., at 19.8 and Boston at 17.9. Six large cities, including Tulsa, Orlando and Toledo, reported none at all, and Fort Worth, with more than 1 million residents, reported one. Numbers that low say more about how a department records hate crimes than about the city.
Attitudes moved first
Crime reports are one measure. Surveys of what Americans believe are another, and some of them have moved a long way. When Gallup first asked in 1958, 4% of Americans approved of marriage between Black and white people, and by 2021 that share was 94%, the highest Gallup has recorded. The FBI's 2026 figures, due next fall, will show whether the two-year decline holds.


How we counted: Hate crime incidents by state, city and bias come from the FBI Crime Data Explorer (cde.ucr.cjis.gov), as refreshed Oct. 15, 2026, summing monthly incidents for each year. These totals run slightly higher than the FBI's printed annual report, which counted 10,881 incidents in 2025 and 11,679 in 2024, a 6.8% drop, because agencies keep submitting data after publication. State rates divide incidents by the residents covered by reporting agencies (the state population times the FBI's coverage percentage). City rates use the population the FBI lists for each police department; cities that didn't report all 12 months (New Orleans, Baton Rouge and Cape Coral) are left out. Bias categories count incidents with a single recorded bias; multiple-bias incidents are counted separately. The 2005–2019 victimization estimate is from the Bureau of Justice Statistics report "Hate Crime Victimization, 2005–2019" (NCJ 300954, September 2021). The marriage figures are from Gallup's July 2021 survey. Year-to-year changes in small states can reflect a handful of incidents or a change in how agencies report. FBI Crime Data Explorer. FBI 2025 summary report. BJS. Gallup. The State of Hate (2016). Download our data (CSV).