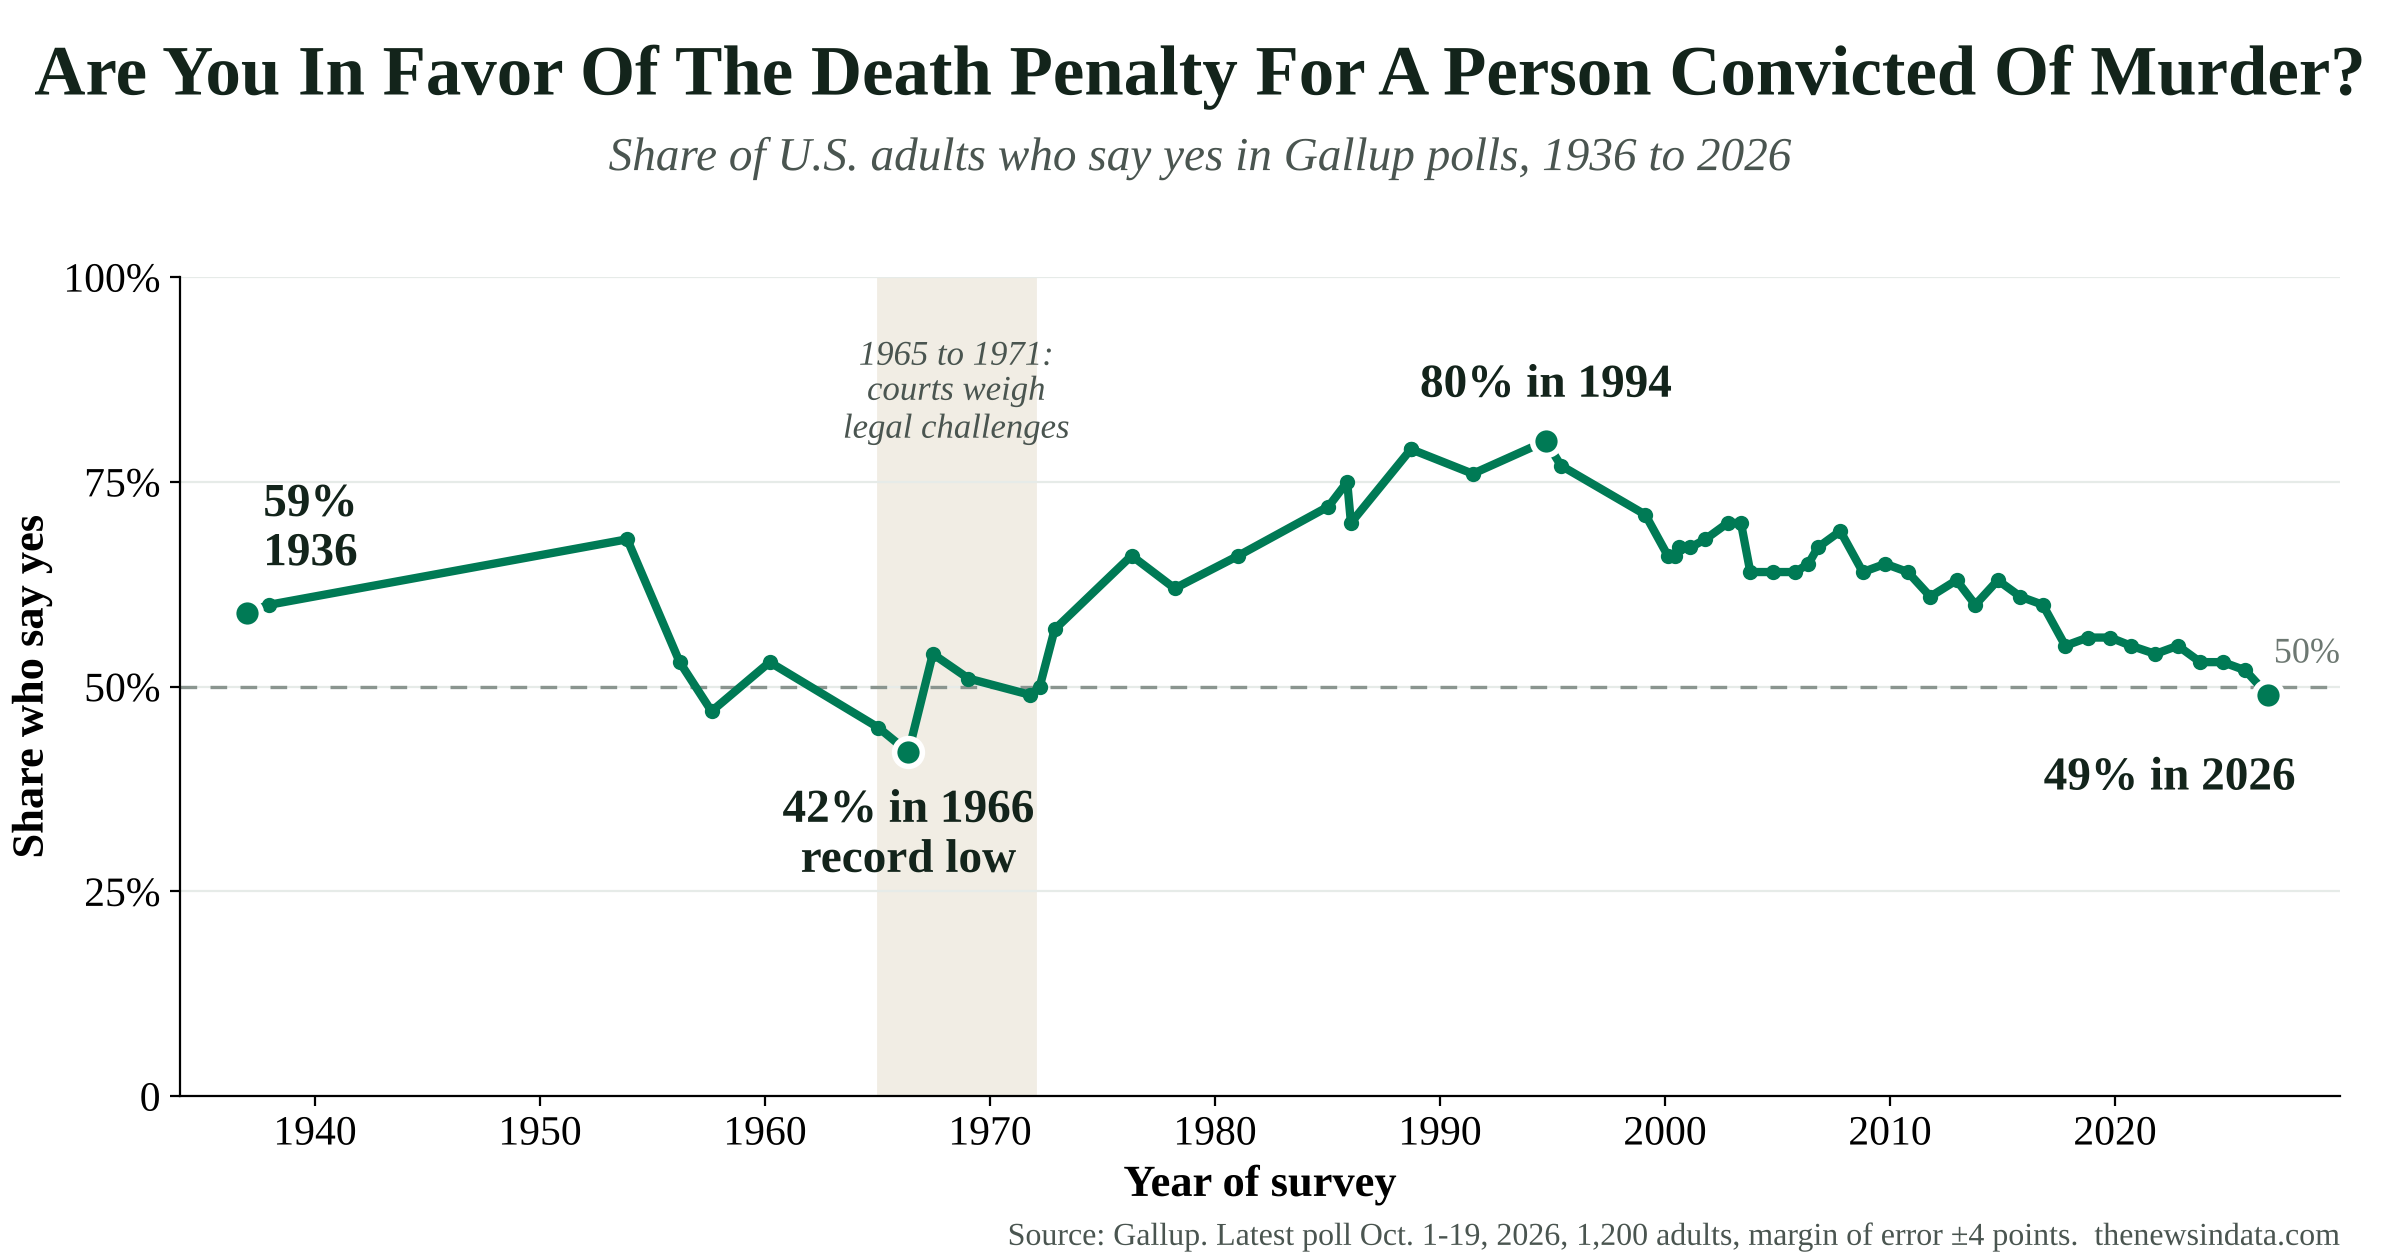
Gallup has asked Americans the same question since 1936: "Are you in favor of the death penalty for a person convicted of murder?" In the newest poll, released Nov. 10, 49% said yes and 45% said no. It is the first time since 1971 that fewer than half were in favor.
The one-year change is small. Support was 52% in October 2025, and with a margin of error of plus or minus 4 points Gallup calls the two readings statistically similar. The longer line is what changed: support peaked at 80% in 1994 and has drifted down for three decades.
Slide across the chart below to read any of the 57 polls, or switch to the party view.
Ninety years of one question
The first poll, in December 1936, found 59% in favor and 38% opposed. Support has been below half in only five of the 57 polls: 1957, 1965, 1966, 1971 and now 2026. The record low is 42%, in May 1966, the only time more people opposed the death penalty (47%) than favored it.
Gallup notes that most of those low readings came between 1965 and 1971, when legal challenges to state death penalty laws were moving through the courts. In 1972 the Supreme Court ruled that the laws as then written were unconstitutional. States rewrote them, and executions resumed in 1977.


By then support had climbed back to 66%. It stayed at 60% or higher for the next 40 years, then dipped to 55% in 2017 and held in the low-to-mid 50s until this year. The 45% now opposed is the most since 1966.
Democrats moved the most, and Republicans dipped this year
All three party groups are less supportive than they were in the 1990s. Democrats changed the most: 28% are in favor now, down from 56% in 2000 and a high of 75% in 1994. Independents are at 50%, down from 68% in 2000 and 79% in 1994.
Republican support has been steadier, usually near 80% since the 1990s. This year it is 73%, down from 81% a year ago and one of the lowest readings Gallup has recorded for the group. The gap between the two parties is 45 points; from 1990 to 2015 it averaged 25.
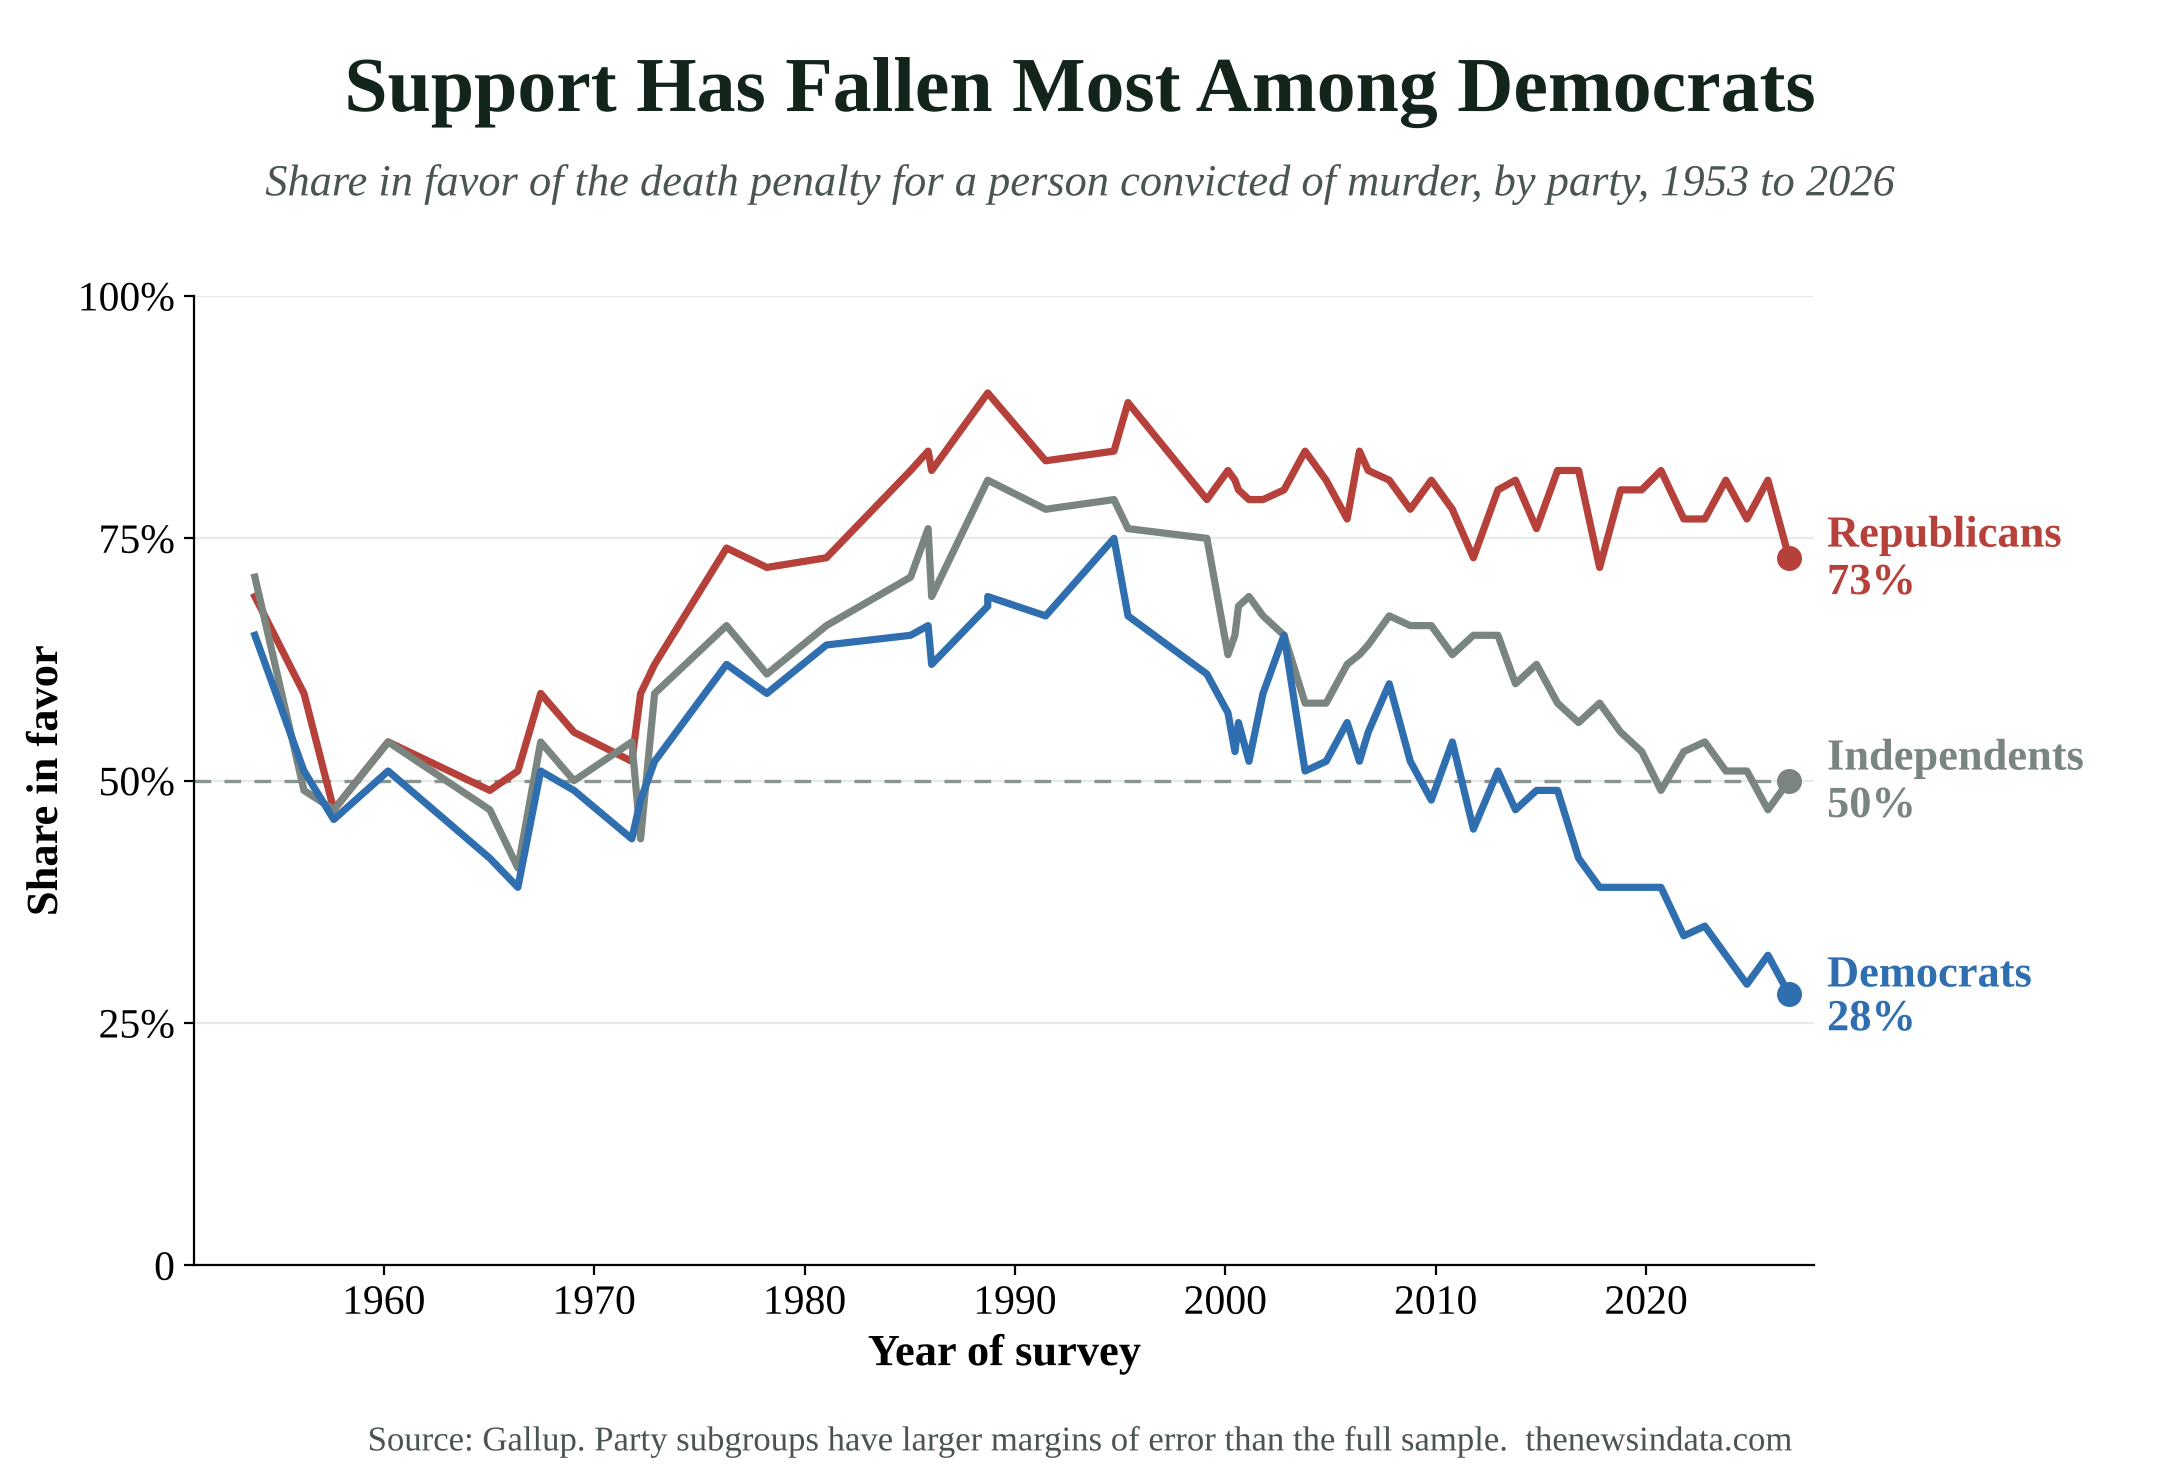
A caution on the party numbers: each group is a few hundred people, so its margin of error is larger than the 4 points for the full sample, and single-year moves like the Republican drop can partly be noise.
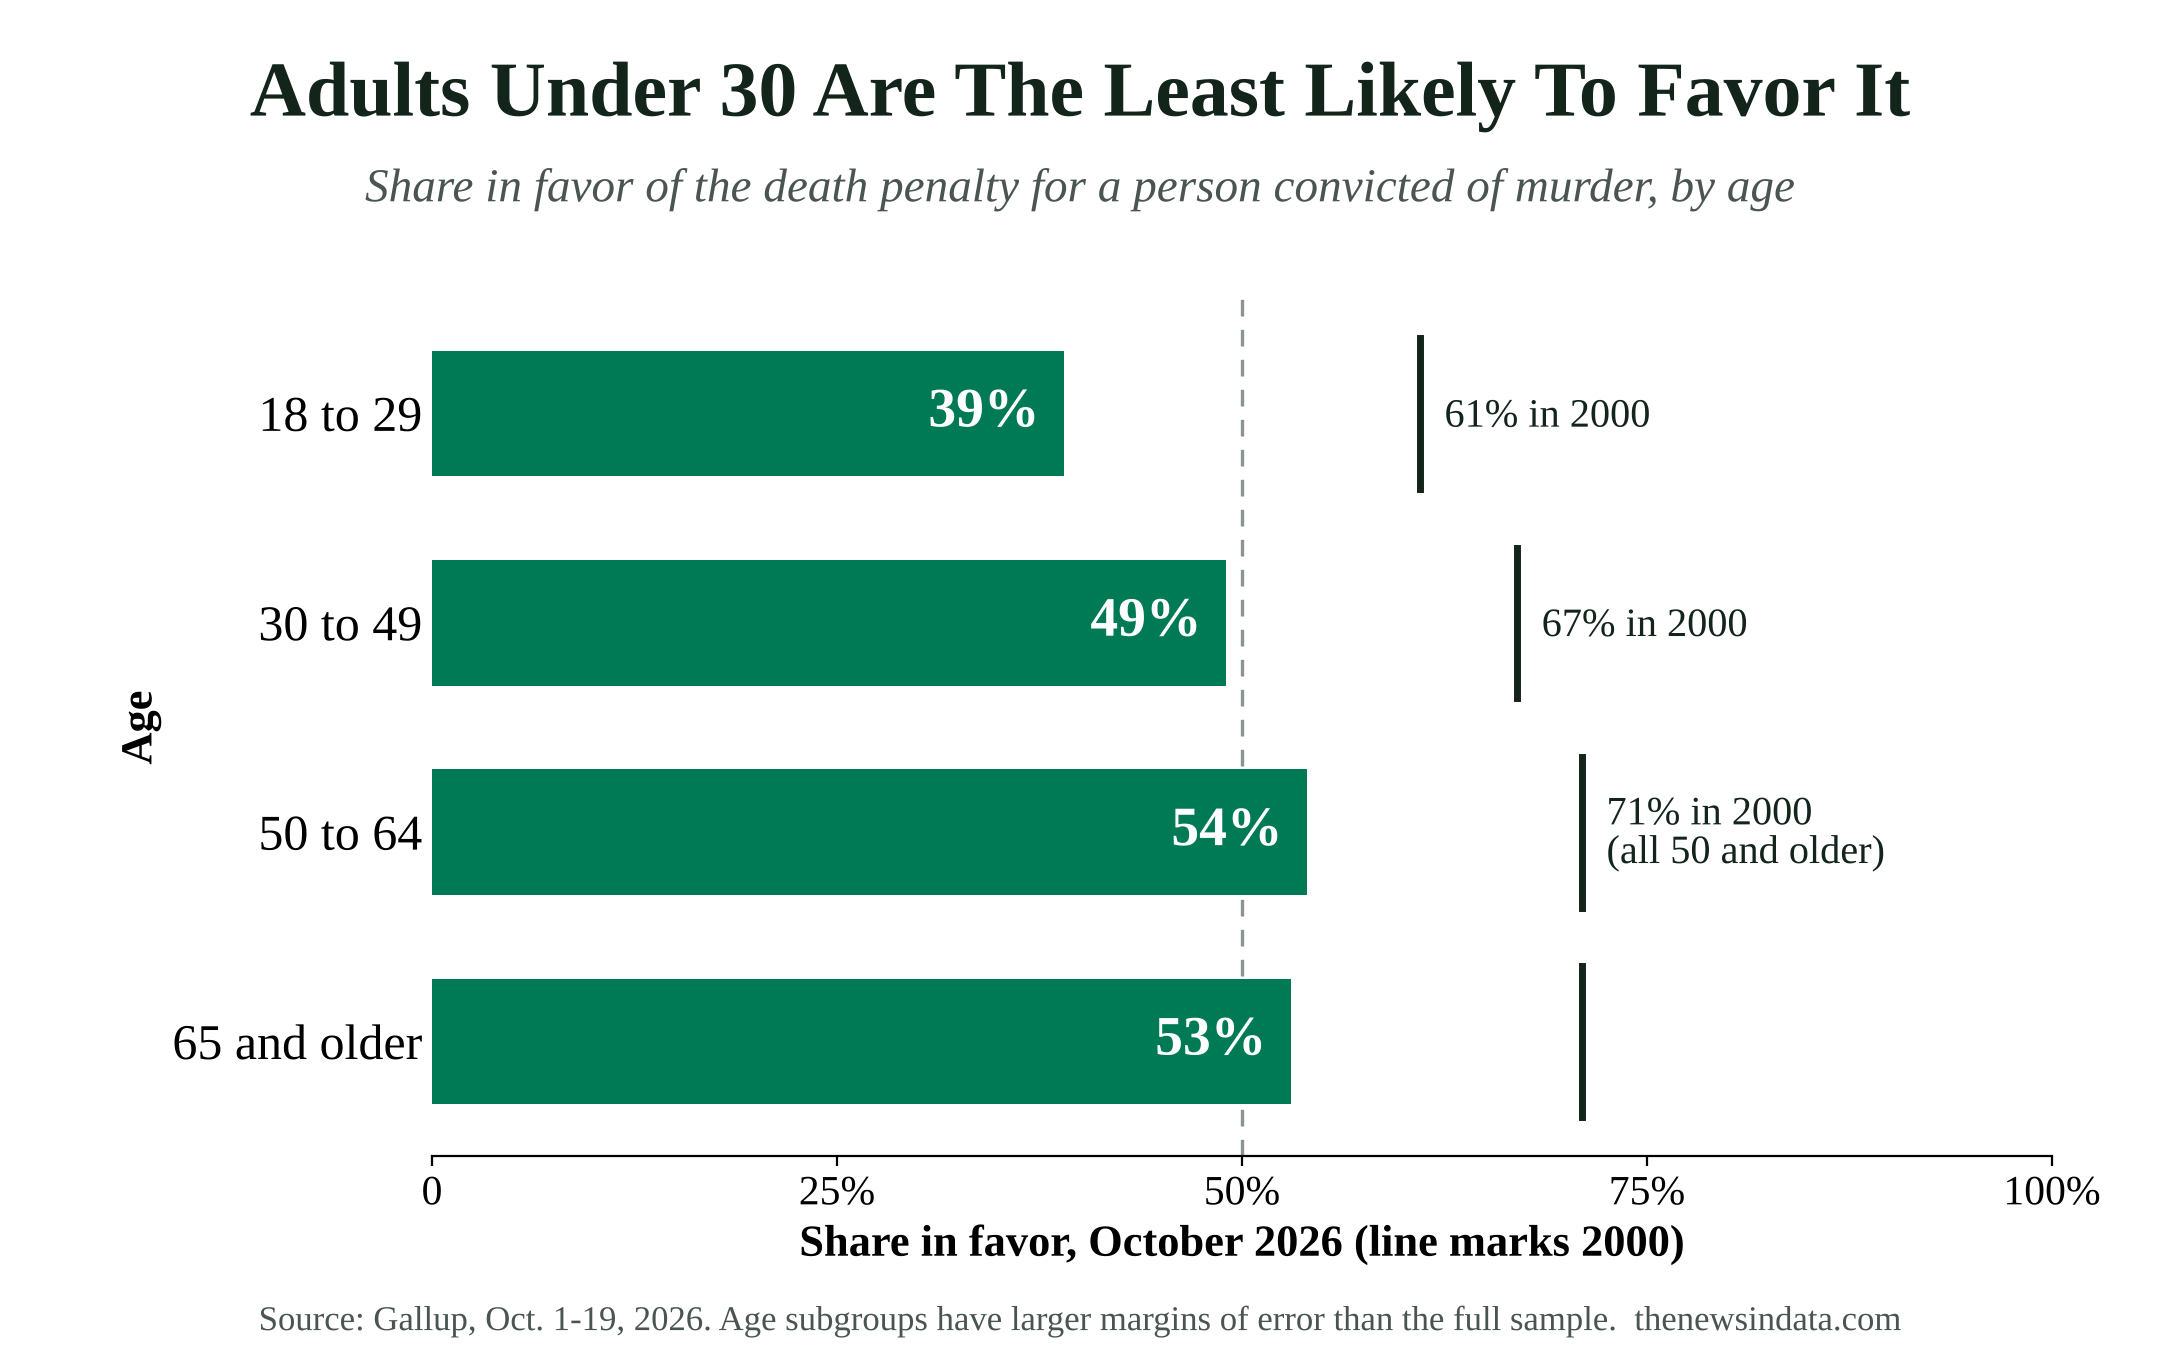
The youngest adults are the least supportive
Among adults under 30, 39% favor the death penalty and 59% oppose it. Support is 49% among those 30 to 49, 54% among those 50 to 64 and 53% among those 65 and older.
Every age group has moved. In 2000, 61% of adults under 30 were in favor, along with 67% of those 30 to 49 and 71% of those 50 and older.
What the poll doesn't say
The question is about the death penalty in general for murder. It doesn't ask about a specific case, about life without parole as an alternative, or about how the penalty is applied, and Gallup has found that answers shift when those are offered. It also can't say why opinion moved. Gallup points out that this year's interviews began the day after a failed execution attempt in Tennessee, which led the governor to pause executions there, but one poll can't separate that from the long decline.


How we counted: All figures are from Gallup. The latest poll was conducted by telephone Oct. 1-19, 2026, with 1,200 U.S. adults; the margin of sampling error is plus or minus 4 percentage points for the full sample and larger for party and age groups. The trend is 57 polls from December 1936 to October 2026, plotted by the month of each survey; Gallup's own chart omits one of them (May 2003). Party figures begin in 1953. Gallup's report and historical trends. Download our data (CSV).