China's carbon dioxide emissions fell 3.1% from a year earlier in July through September, the largest quarterly drop since the Covid lockdowns of 2022, according to an analysis by Lauri Myllyvirta of the Centre for Research on Energy and Clean Air, published by Carbon Brief on Nov. 6. By CREA's count, China's emissions have been flat or falling since March 2024 and are down an estimated 0.5% so far this year. That matters more than any other country's trend, because China is where almost all of the world's new coal burning came from.
Almost all new coal was China's
The world burned 20,100 terawatt-hours more coal in 2025 than in 1988, according to the Energy Institute's 2026 Statistical Review of World Energy, compiled by Our World in Data. China added 19,900 terawatt-hours of that, or 99%. Coal use in the rest of the world, taken together, rose from 20,200 terawatt-hours in 1988 to 20,500 in 2025, an increase of about 1%.
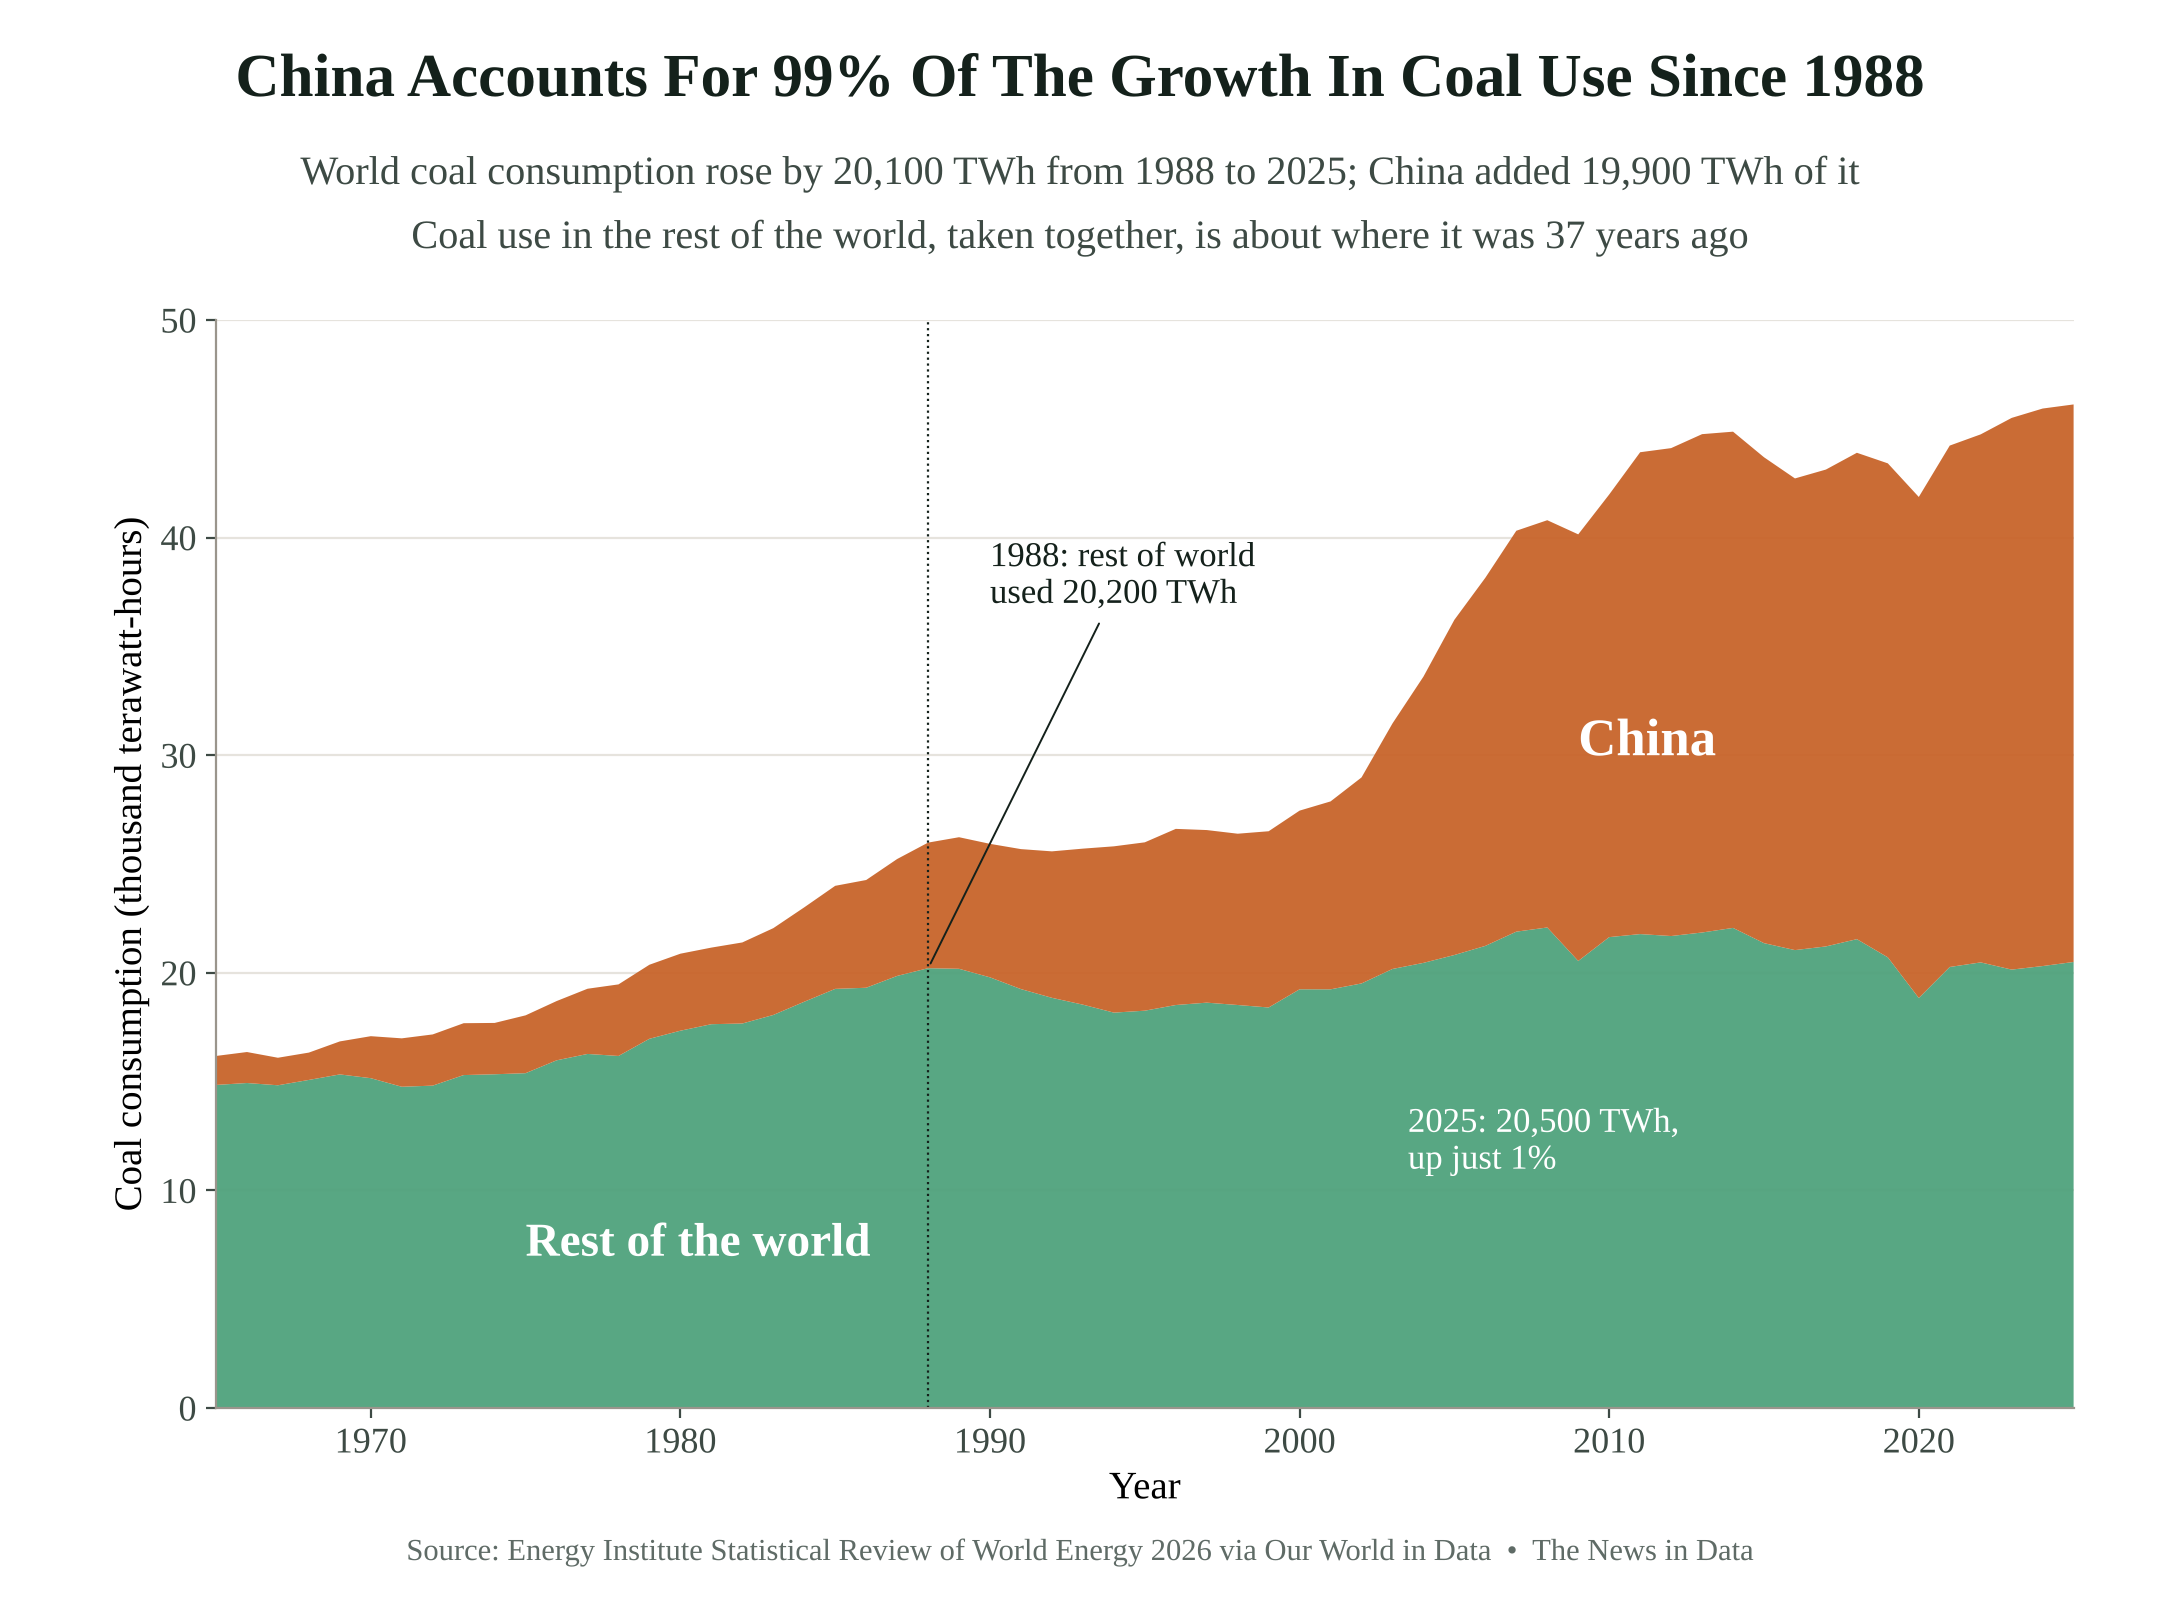
China now burns more coal than every other country combined: about 25,600 terawatt-hours in 2025, or 56% of the world total. Its coal use was flat from 2024 to 2025, and CREA estimates it fell 3% in the third quarter of 2026, with coal power down 3.3%.
Explore the chart below to see how China's share grew from 8% in 1965 to more than half.
What changed in China
Clean power is now growing faster than China's demand for electricity. In the third quarter, generation from solar, wind and nuclear rose by 110 terawatt-hours from a year earlier, more than twice the growth in demand, CREA found. Oil use fell 4%, and oil used for transport fell 9%, as electric vehicles reached a record 67% of passenger car sales in September. Part of the oil drop was not by choice: the crisis around the Strait of Hormuz has kept oil demand down, the analysis said.


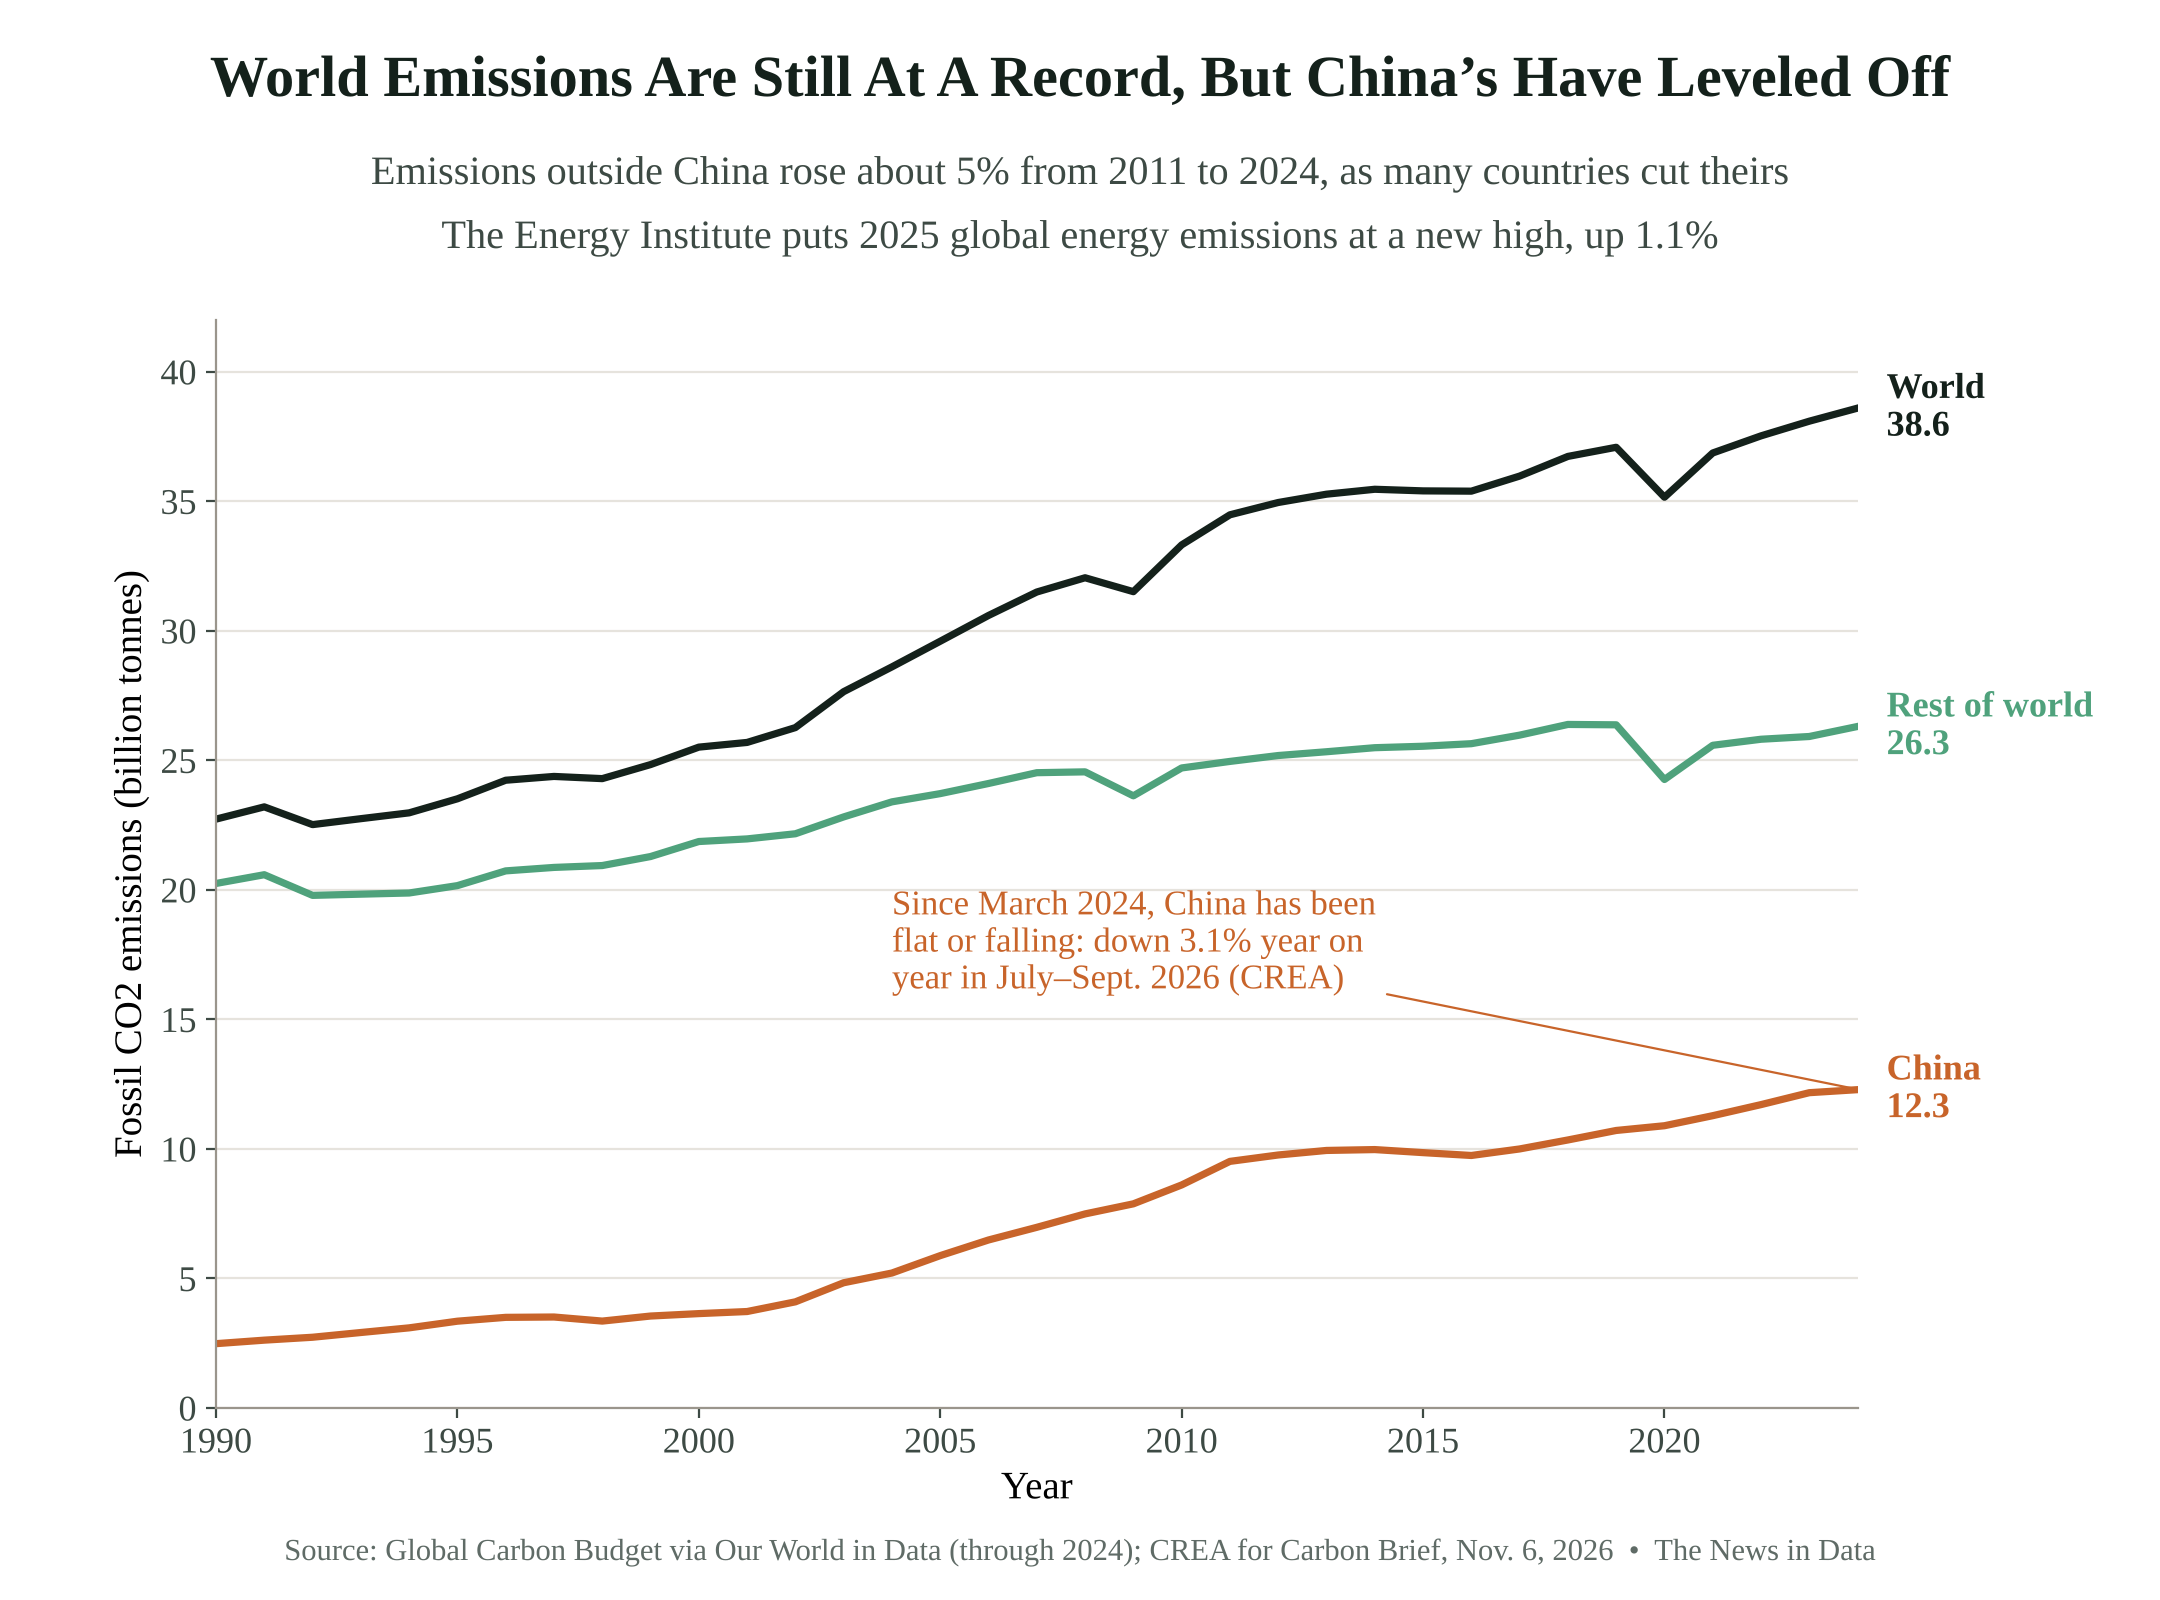
China's emissions are not yet falling year after year, and it is still building coal power plants at near-record rates, though those plants are running fewer hours. The country set its own target of peaking emissions before 2030. A sustained decline would be the largest single change in the world's emissions outlook.
Many countries are well past their peak
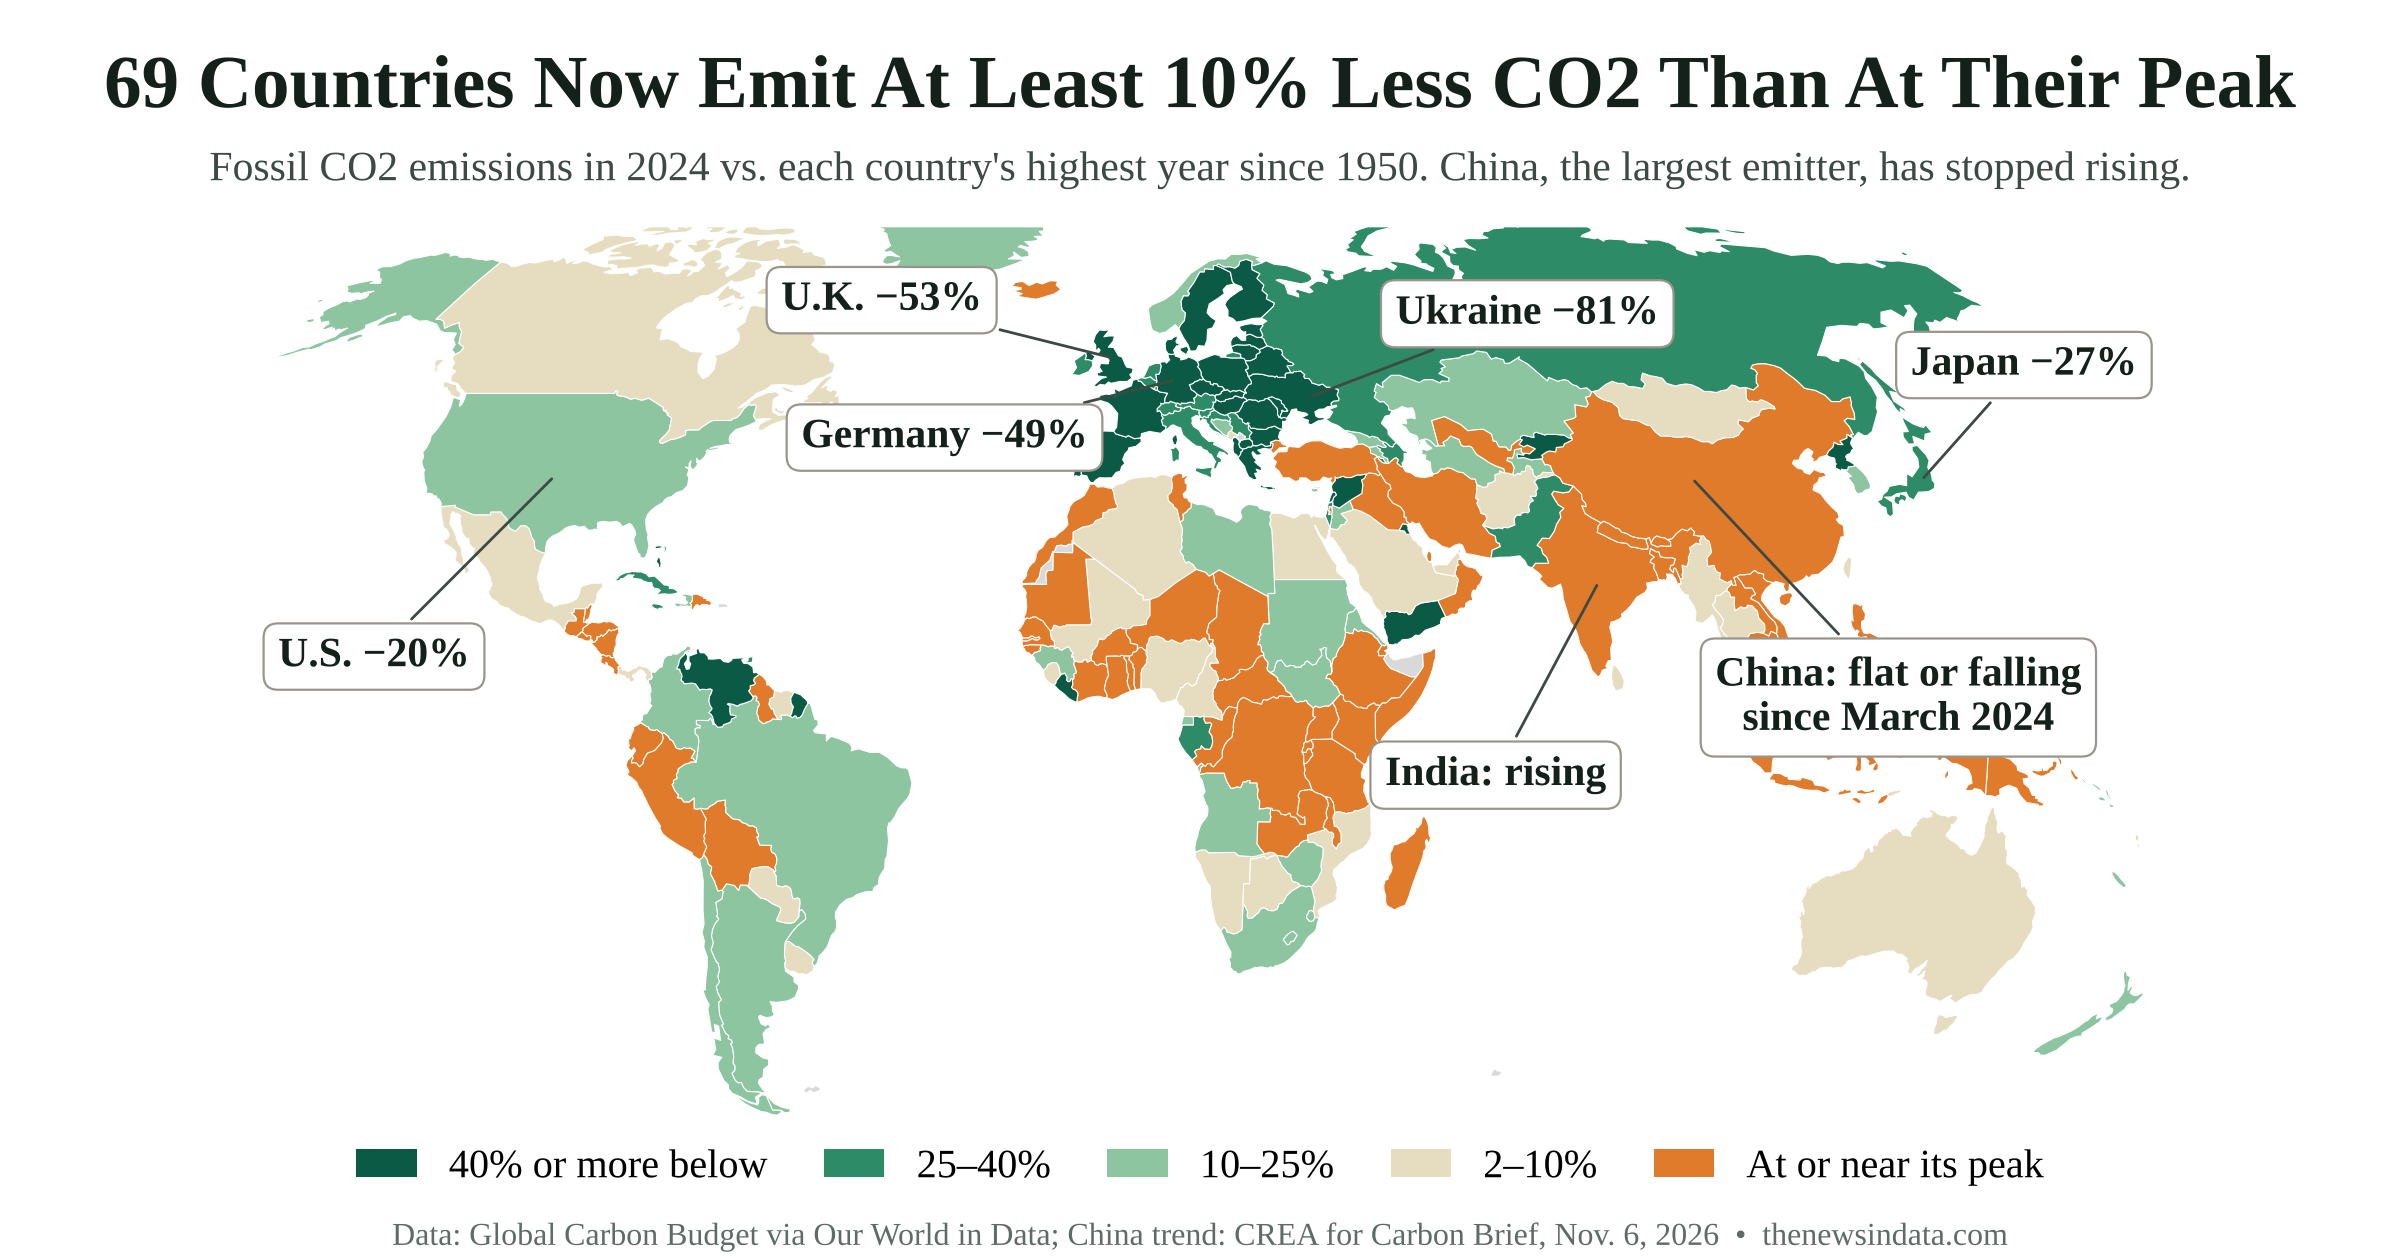
Of the 118 countries whose annual fossil CO2 emissions have ever topped 10 million tonnes, 69 emitted at least 10% less in 2024 than in their peak year since 1950, according to Global Carbon Budget figures compiled by Our World in Data. Together, those 69 countries emit about 6.9 billion tonnes less a year than they did at their peaks.
The United Kingdom, which closed its last coal plant in 2024, emits 53% less than in 1971. Germany is down 49% from 1979, France 51% from 1973, Japan 27% from 2013 and the United States 20% from 2005. The steepest declines are in former Soviet and Eastern Bloc countries, such as Ukraine, down 81%, where emissions collapsed with heavy industry after 1990 and, in Ukraine's case, again after Russia's invasion.


Use the map below to look up any country.
The world total is still rising
None of this has yet turned the global total around. Emissions from energy hit a record 41.0 billion tonnes of CO2 equivalent in 2025, up 1.1% from 2024, according to the Energy Institute. Emissions rose in the United States and India, while China's were essentially unchanged and the European Union's fell. Outside China, fossil CO2 emissions rose about 5% from 2011 to 2024.
The growth is now coming mostly from countries that are still industrializing, such as India, Indonesia and Vietnam, where emissions are at record highs. Whether China's plateau becomes a decline, and whether those countries follow a cleaner path than China did, will decide when the world's emissions finally peak.


How we counted: Coal consumption is from the Energy Institute Statistical Review of World Energy 2026, via Our World in Data; "rest of the world" is the world total minus China. Peak comparisons use annual fossil CO2 emissions (excluding land use) from the Global Carbon Budget via Our World in Data, comparing 2024, the latest year available, with each country's highest year since 1950, for the 118 countries whose emissions ever exceeded 10 million tonnes. China's 2026 figures are CREA estimates published by Carbon Brief. OWID coal data. OWID CO2 data. Carbon Brief analysis. Energy Institute Statistical Review. Download our data (CSV).