The CDC has confirmed 5,412 measles cases in the United States this year, as of Nov. 12. That is more than double the 2,289 cases in all of 2025, more than four times the 1,274 cases in 2019, and the most in any year since 1991.
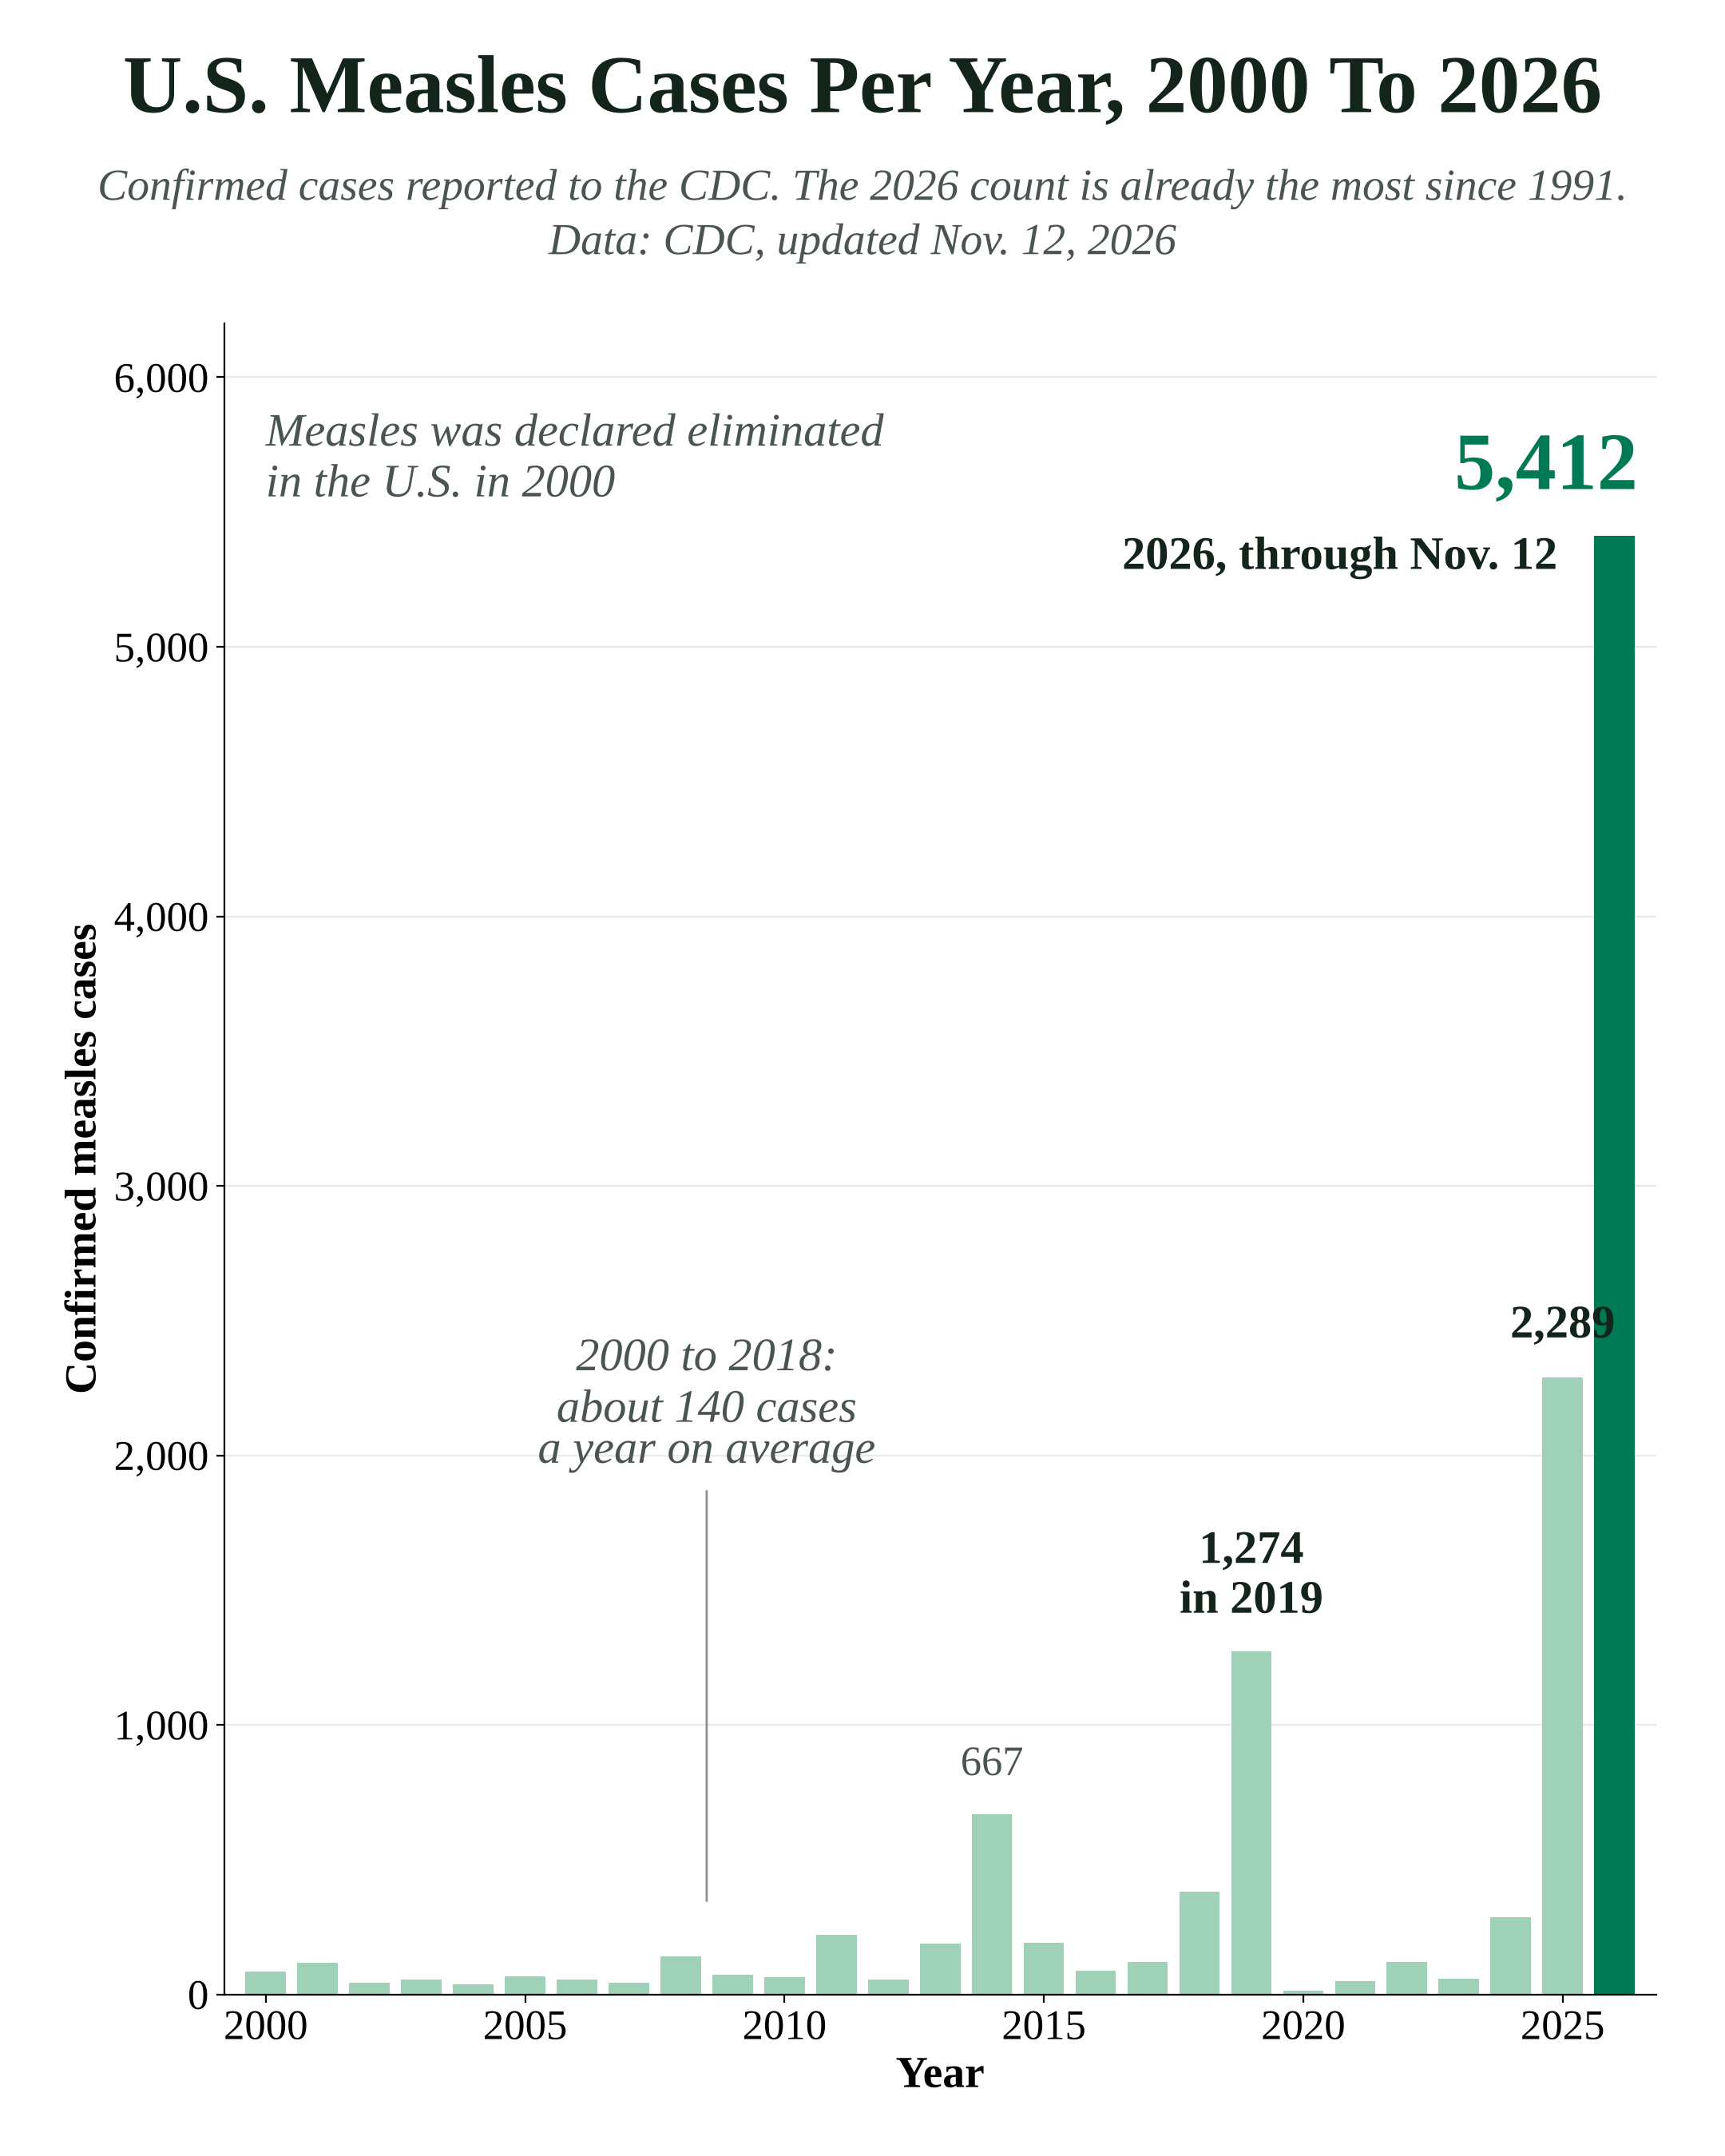
For most of this century the number barely registered. From 2000, when measles was declared eliminated in the U.S., through 2018, the country averaged about 140 cases a year.
Tap your state on the map below to see how many kindergartners lack the measles vaccine and how many cases it has reported this year.
A line that was flat for two decades
Elimination doesn't mean zero cases. It means the virus hasn't spread continuously inside the country for 12 months or more; cases arrive with travelers and the chains of infection burn out. The U.S. has held that status since 2000.
It may not hold it much longer. A commission of the Pan American Health Organization is reviewing the U.S. status, according to a Nov. 13 analysis by Josh Michaud of KFF, a health policy research group. Canada lost its status after an outbreak that began in October 2024 and was declared over last month.


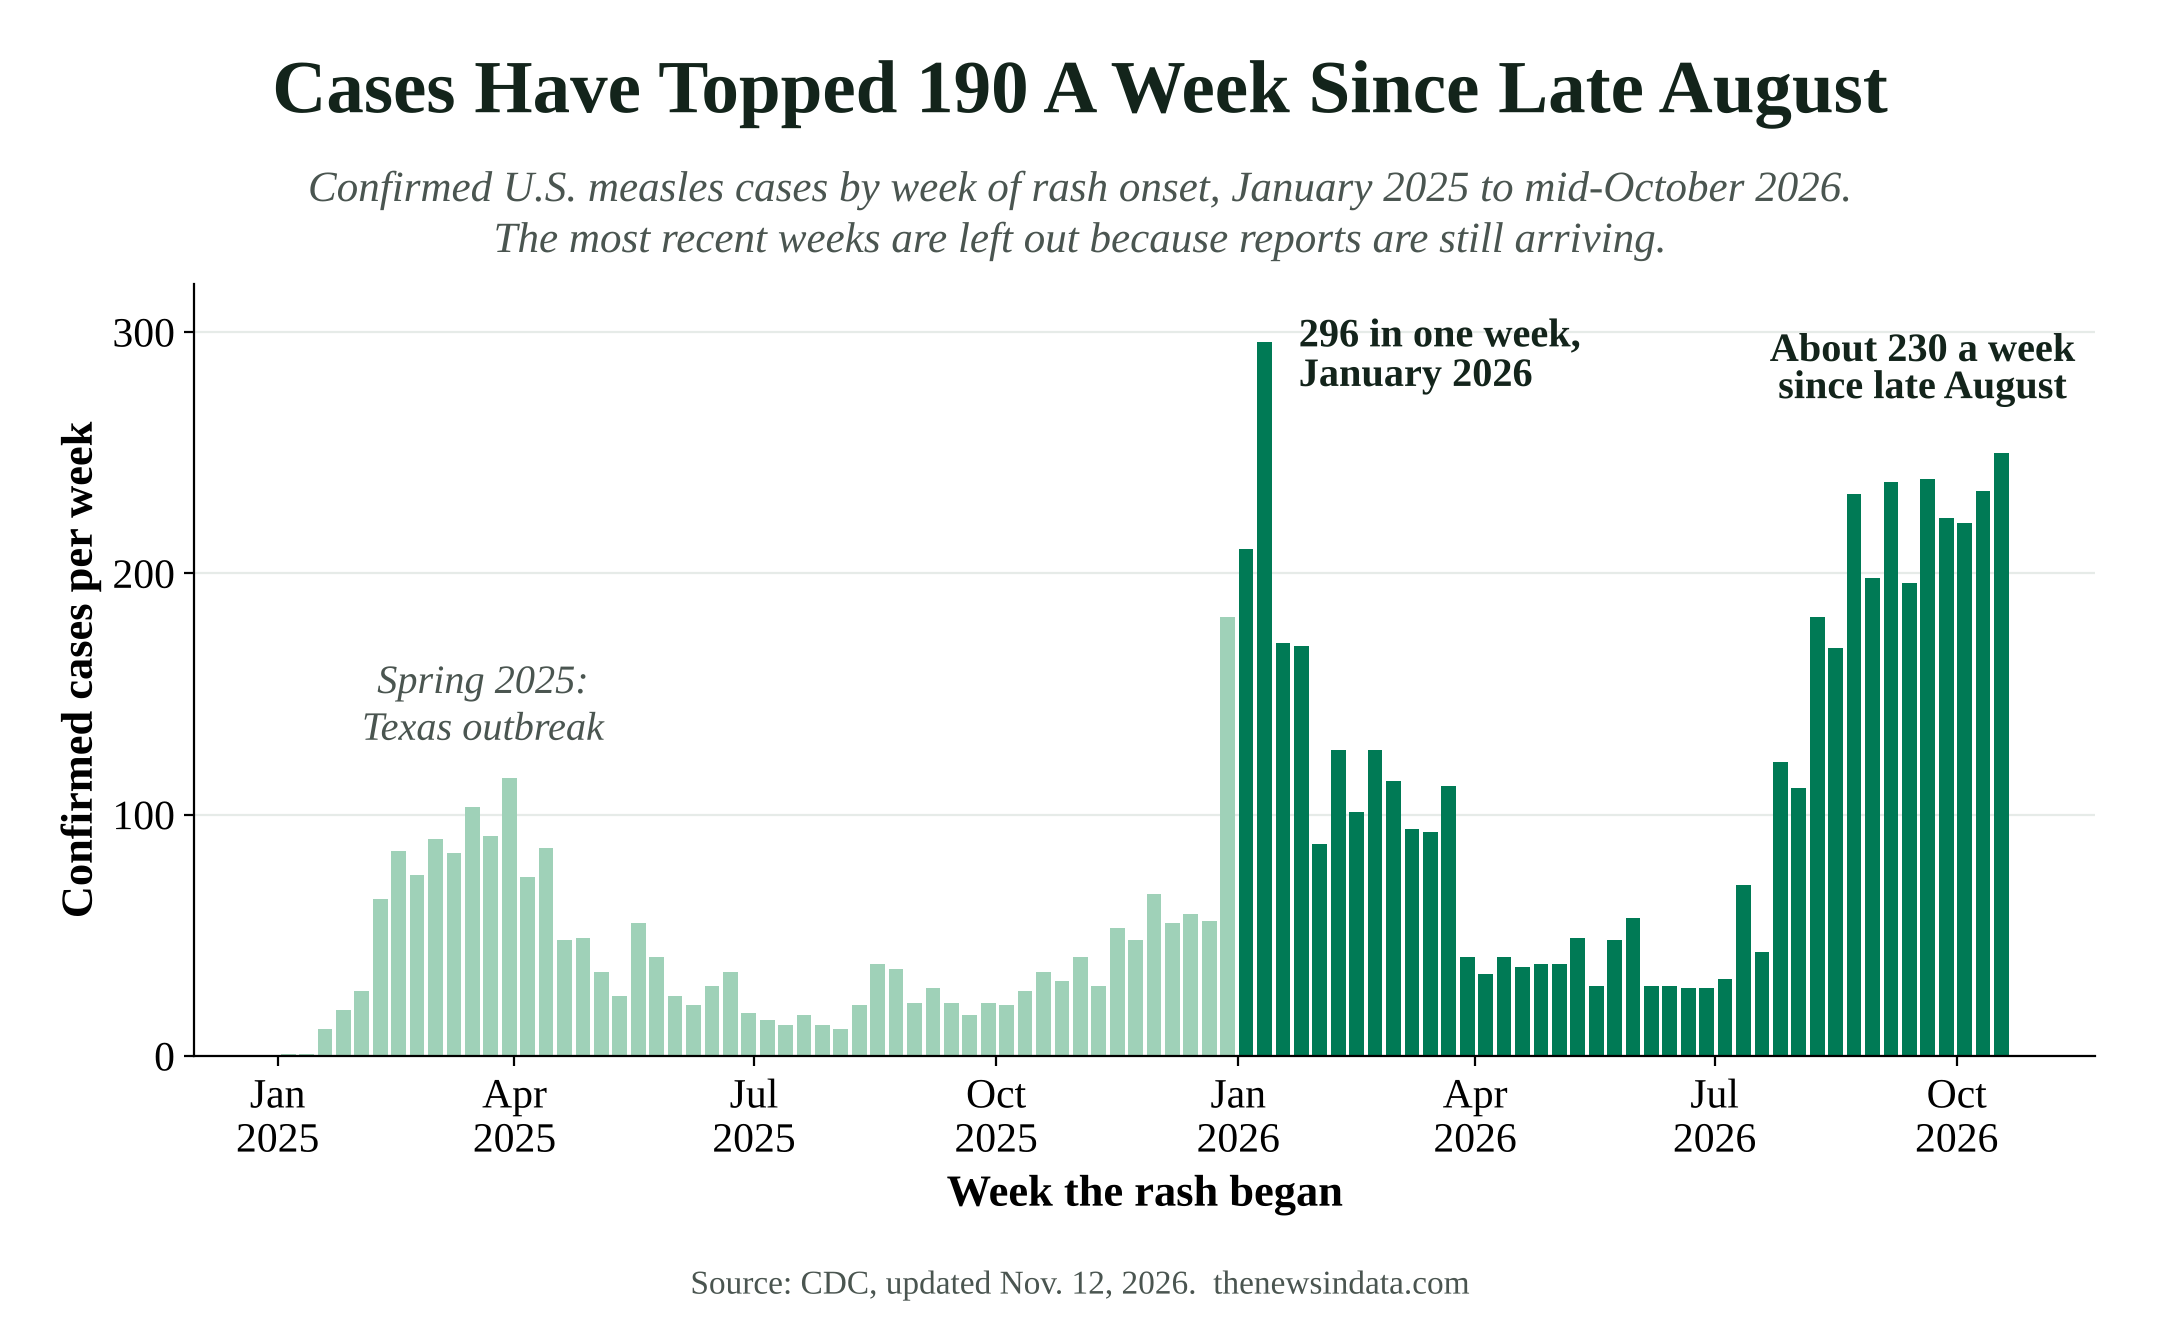
This year's cases are not a single flare. The CDC counts 43 new outbreaks in 2026, each with three or more linked cases, and 96% of all cases belong to an outbreak. Cases peaked at 296 in one week in January, fell to about 30 a week by June, then climbed again. Since late August the country has averaged about 230 new cases a week.
Where the cases are
Forty-six states and Washington, D.C., have reported at least one case this year. Pennsylvania has reported 1,529, more than a quarter of the national total, followed by South Carolina (670), Utah (536), Wisconsin (505) and New York (217, including New York City).
The map moves from year to year. Texas had 803 cases in 2025 and has 192 this year. Pennsylvania had 16 last year.
About 11% of this year's patients have been hospitalized, including 17% of children under 5. The CDC has confirmed eight deaths in 2026, after three in 2025. KFF counts three measles deaths in the 18 years from 2001 through 2018.
Children and teens ages 5 to 19 make up 40% of cases, adults 20 and older 41% and children under 5 the remaining 18%.
The vaccine thread
Almost all of this year's patients were not vaccinated, or their status isn't known: 96%, according to the CDC. Another 2% had one dose of the measles, mumps and rubella (MMR) vaccine and 2% had two. The CDC says two doses are about 97% effective at preventing measles.


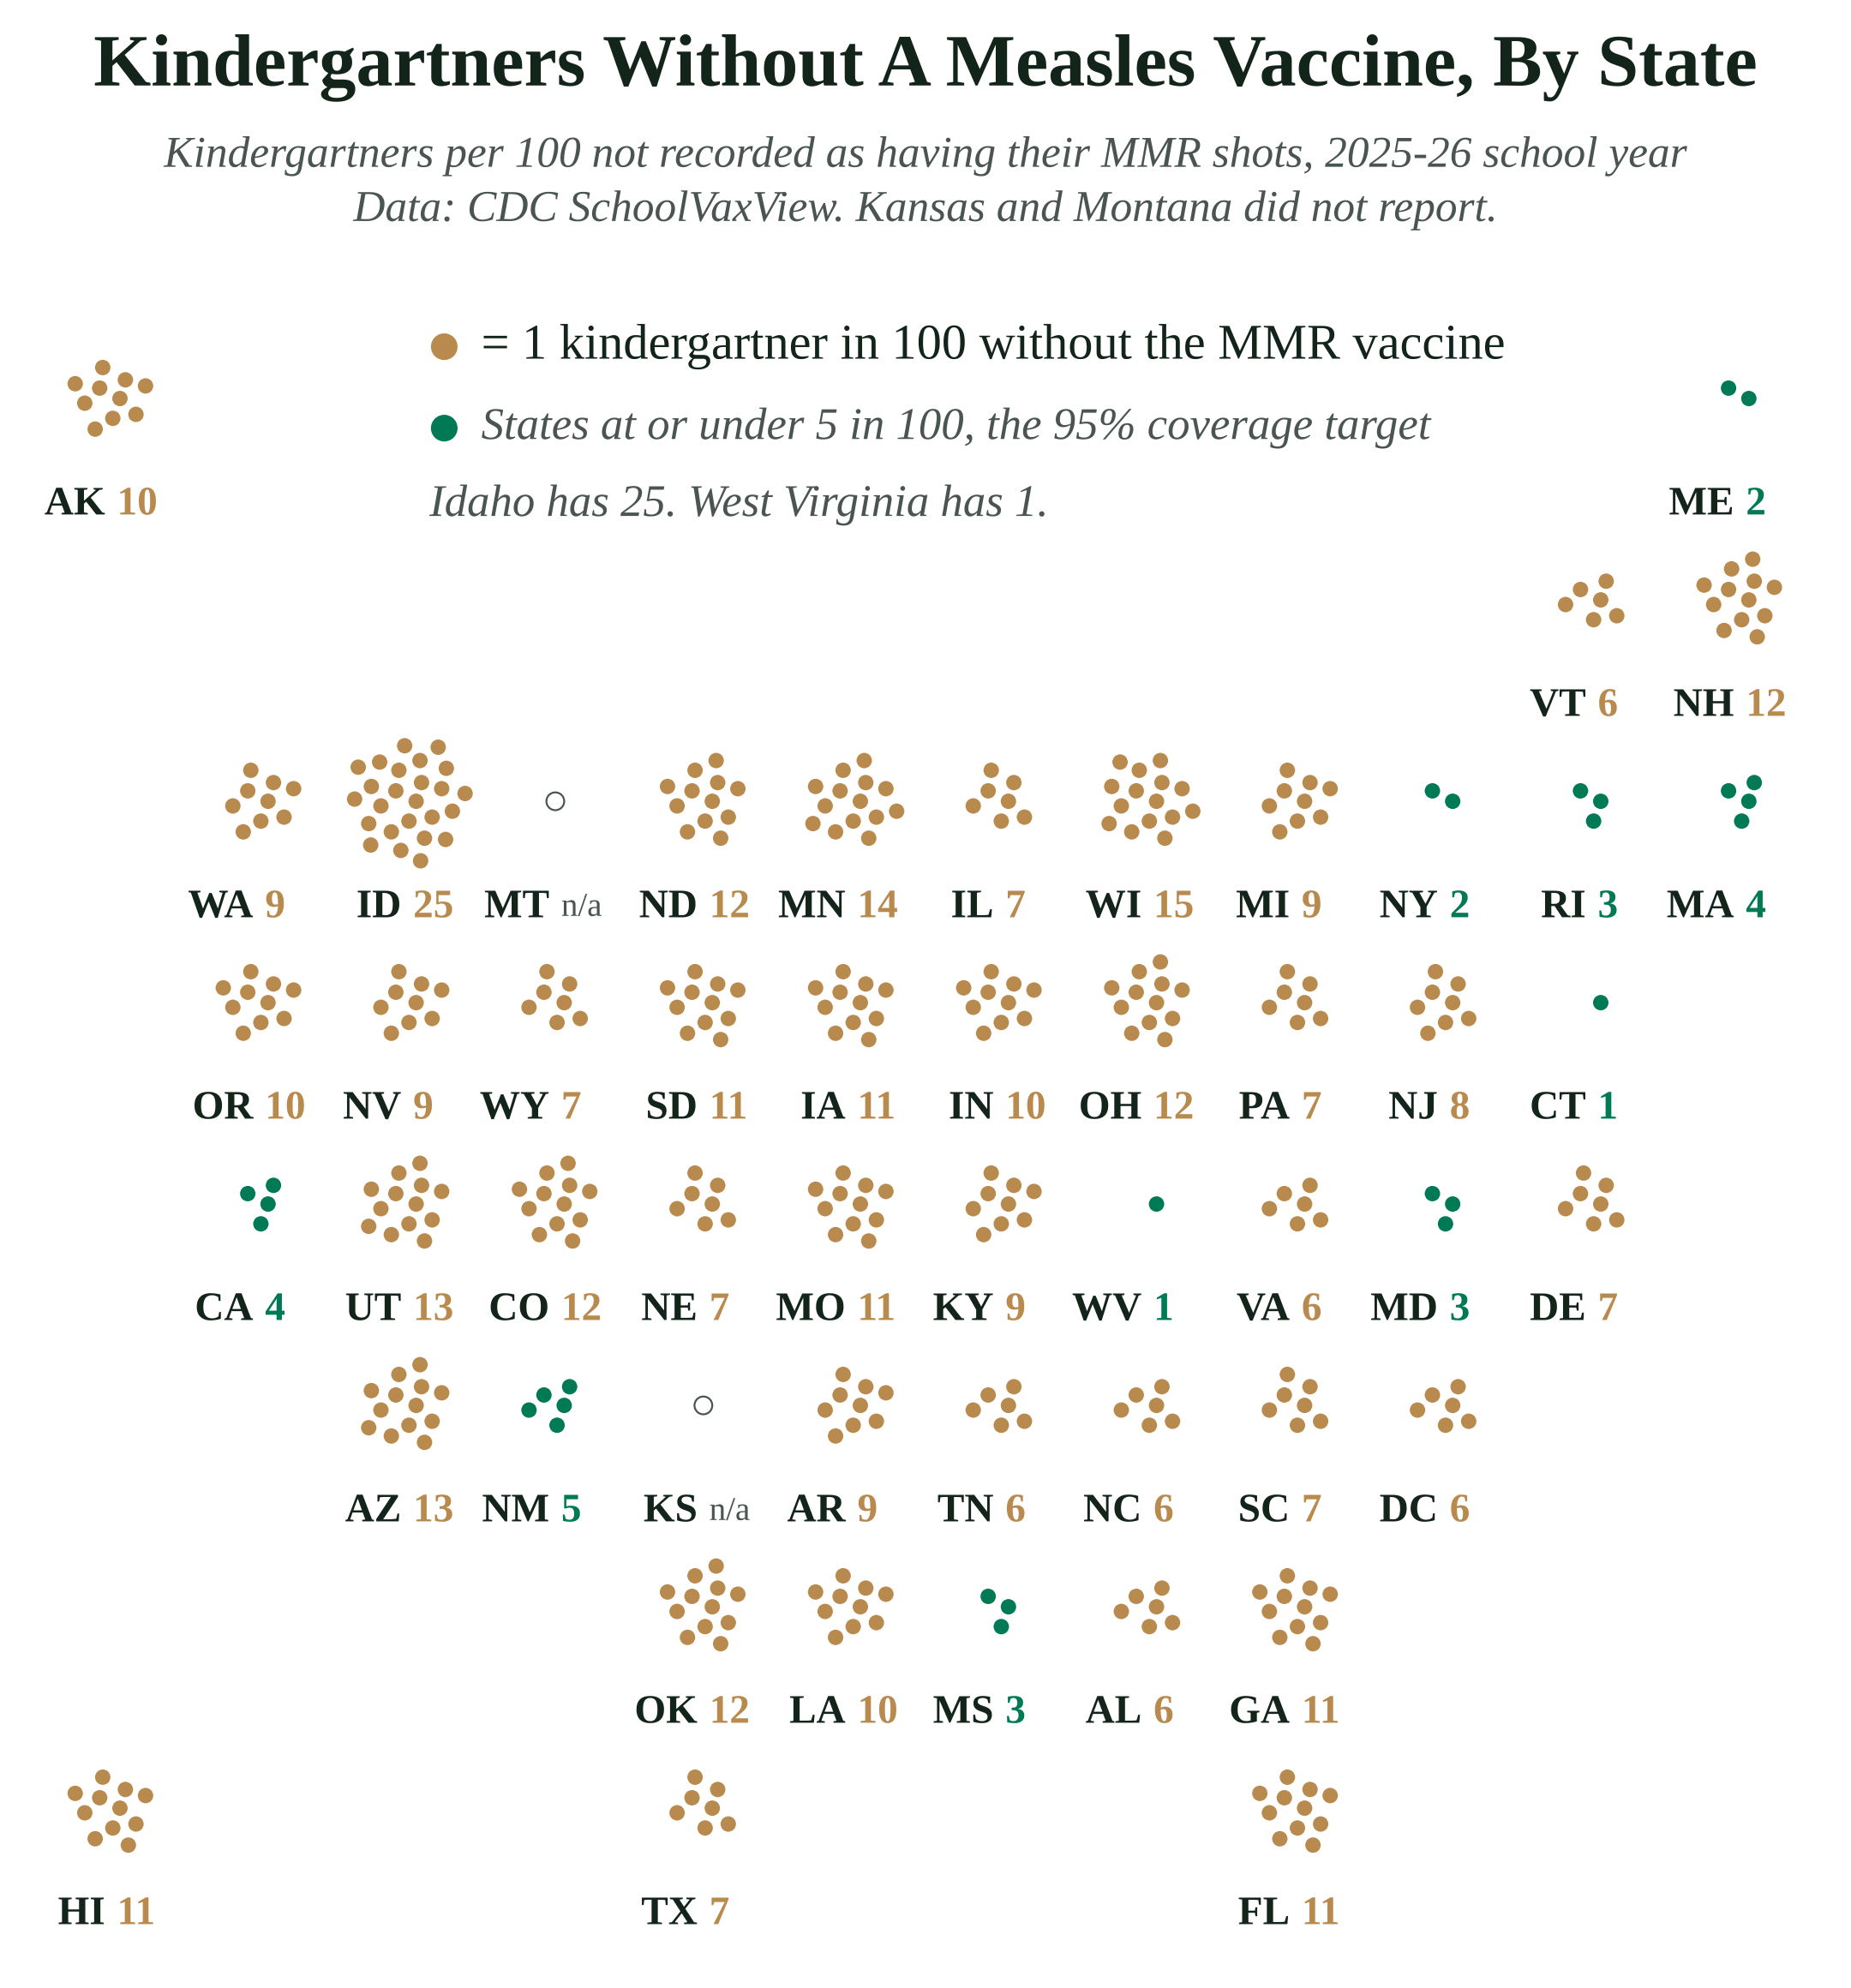
Measles spreads so easily that public health agencies aim for 95% of a community to be vaccinated. Kindergarten classes nationally are below that. In the 2025-26 school year 92.4% of kindergartners had their MMR shots, a record low and down from about 95% in 2019-20, according to KFF's analysis of CDC data. KFF estimates that leaves roughly 280,000 kindergartners unprotected.
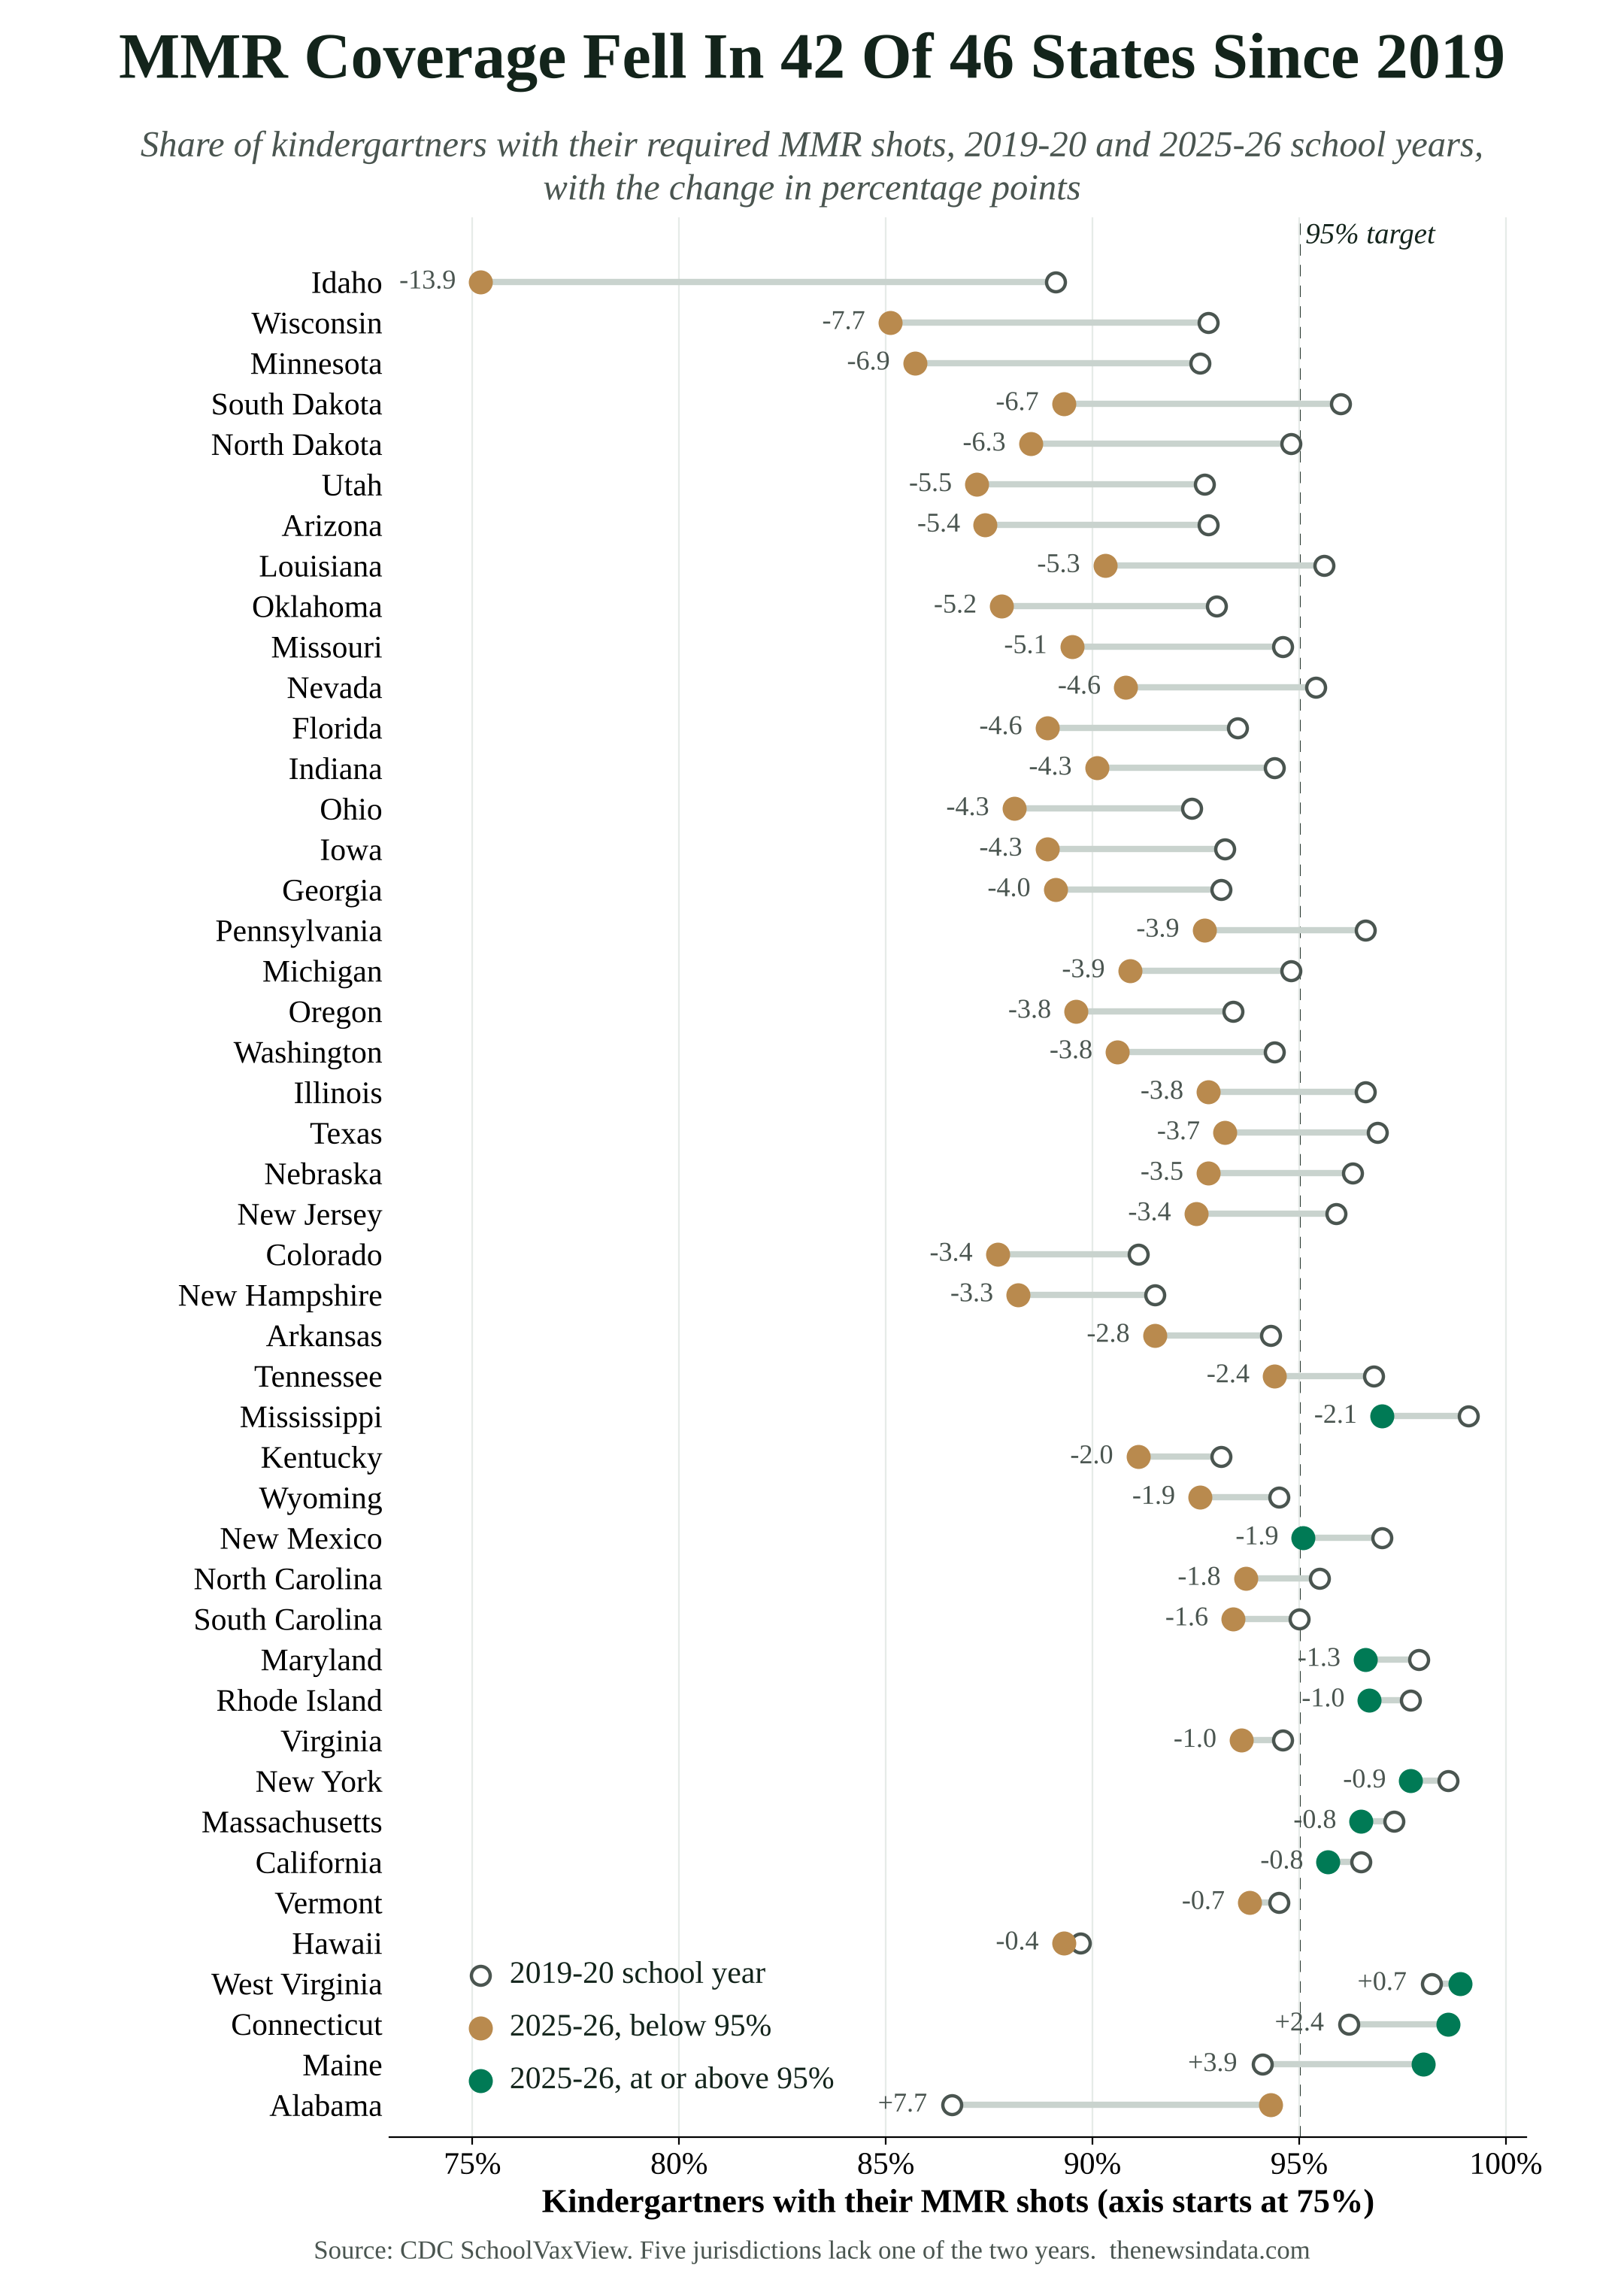
The decline is broad. Among the 46 states that reported in both years, coverage fell in 42. Idaho fell the most, from 89.1% to 75.2%. Thirty-nine states are now below 95%, up from 28 before the pandemic, and 18 are below 90%, up from three.
Most of the change comes from families opting out. The share of kindergartners with an exemption from at least one required vaccine rose from 2.5% to 4.2% over the same six years. Medical exemptions were flat at about 0.2%; non-medical exemptions, for religious or personal beliefs, went from 2.2% to 4.0%. In 24 states more than 5% of kindergartners now have an exemption, up from eight states.
Why families are opting out is harder to measure than how many. KFF's polling finds that about nine in 10 parents still say the measles vaccine is important. It also finds more adults hearing false claims, such as a link between the MMR vaccine and autism, which large studies have not found, and a growing gap between Republicans and Democrats on whether vaccines are safe. KFF's analysis says federal health officials, including Health and Human Services Secretary Robert F. Kennedy Jr., have at times downplayed the risk of measles and given mixed messages on vaccination.
What the numbers can't say
A state's vaccination rate doesn't predict its case count neatly. Pennsylvania has the most cases this year with a kindergarten rate of 92.7%, near the national figure, while Idaho, with the lowest rate, has reported four cases. Measles spreads through pockets: a school, a congregation or a town where coverage is far lower than the state average. Statewide numbers hide those.
The kindergarten figures also count paperwork. A child without records on file is counted as unvaccinated, and some of those children are vaccinated or catch up later.
This year's count is provisional and still rising. And losing elimination status would be a label, with no automatic change in policy. The measure behind it is whether the same chain of infection keeps going for a year.
How we counted: Yearly, weekly and state case counts are from the CDC's measles data page, updated Nov. 12, 2026; the 2026 total includes 18 cases among international visitors that are not assigned to a state, and New York's count includes New York City. Weekly counts are by the date the rash began, and we left the three most recent weeks off the chart because reports for them are incomplete. Kindergarten MMR coverage by state is from CDC SchoolVaxView for the 2019-20 and 2025-26 school years; Kansas and Montana did not report this year, and five jurisdictions lack one of the two years. National coverage, exemption figures and the elimination review are from KFF: Michaud, Nov. 13, 2026 and Williams and others, Aug. 21, 2026. Download our data (CSV).